- One of the difficulties in analysing injection well performance is the variation in pressure and injection rate with time. The Hall plot method can be used to eliminate complications due to these variations
- This original Hall Plot method is based on Darcy's equation for radial flow from the wellbore. Don't use it. Use the modified Hall plot.
- A plot of the cumulative volume injected versus the pressure summation (integration of formation face differential pressure times time) gives what is known as a Hall Plot.
- It is a common (but often inappropriate) simplification to plot only cumulative wellhead pressure against cumulative volume. This has the advantage that only variables directly measurable at the surface; wellhead pressure and injection rate, are needed. Don't do this. The slope of the simplified Hall plot is skewed and no longer has a quantitative meaning.
- Adjust the available pressure information to bottomhole conditions, by adding on hydrostatic head and subtracting the correct tubing and perforation friction and reservoir pressure. You can use the Well Hydraulics routine in the PWRI Toolbox. The modified Hall plot method is based on plotting the injection pressure potential {the integral of pbh - pe with respect to time} against the cumulative injection, Wi. USE THIS. It is the Modified Hall Plot.
|
|
|
|
|
- Yes, except that the slope has a different meaning. The inflow can no longer be assumed to be radial and the slope will represent a more complex geometry. From Joshi´s equation for horizontal wells the slope can be derived as (use whichever analytical approximation of horizontal injection that you prefer).
- For inclined holes, recognize that there will be a skin component due to deviation?
- The Hall plot method is also valid for fractured injectors. You will need to incorporate skin into the radial flow equation for quantification of the effect of the fracture. The Hall plot does offer a means of quantitatively determining skin and changes in skin by manipulating the basic equations.
|
|
|
|
|
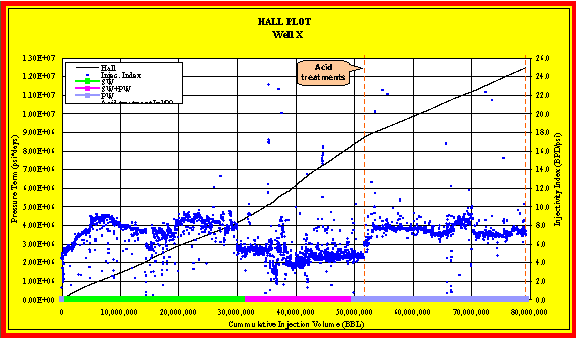
- Figure 1 illustrates a Modified Hall Plot with several changes in slope accompanied by possible explanations for the well injectivity changes.
-
In order for slope changes on the Hall Plot to be correctly interpreted the reservoir pressure must be included, i.e. the Modified Hall Plot must be used.

Figure 1. A characteristic modified Hall Plot, showing fluctuations due to the type of fluid (influencing bottomhole formation face pressure and mobility) and an acid treatment. In this case, the slope is governed more by viscosity than by stimulation.
- An increase in the slope indicates an accumulation of damage. If skin is calculated from the basic relationships, it will be seen to increase with increasing slope.
- A decrease in the slope indicates an improvement in injectivity. If skin is calculated from the basic relationships, it will be seen to decrease with decreasing slope. This could be due to stimulation or to changes in the injected fluid, to a shut-in, to changes in the formation pressure that have not been corrected accounted for, to reductions in the tubing friction (i.e., an acid wash and pickling).