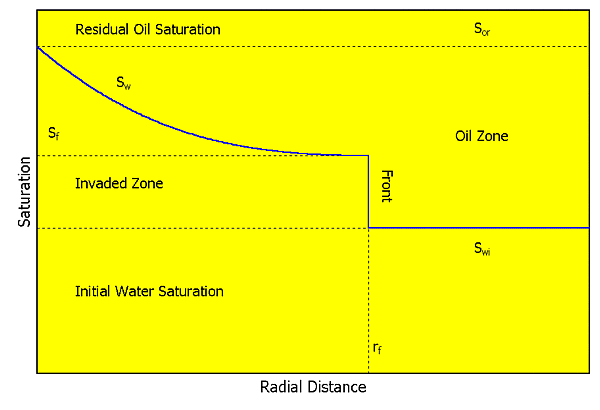
|
| Figure 1. This is a schematic saturation profile that is consistent with Buckley Leverett displacement concepts - radial flow. |
Although conceptually the only mathematical difference between injection and production well testing are the sign of the rate - injection is negative - there are many more complications in injection wells. Water injection is an immiscible displacement process - one fluid displaces another. You are not dealing with flow of a homogeneous fluid. In addition, reservoir conditions will likely not be isothermal since the injected fluid will inevitably have a somewhat different temperature than the reservoir. You may have the following:
An injection well can be considered as a situation of radial discontinuity in mobility, k/m and disffusivity, fmct/k, with the added complication of a moving boundary. The situation is even more complicated when a fracture is present. For radial, matrix flow, you may have the following limiting situations:
There are two displacement models that are commonly used for analysis:

|
| Figure 1. This is a schematic saturation profile that is consistent with Buckley Leverett displacement concepts - radial flow. |
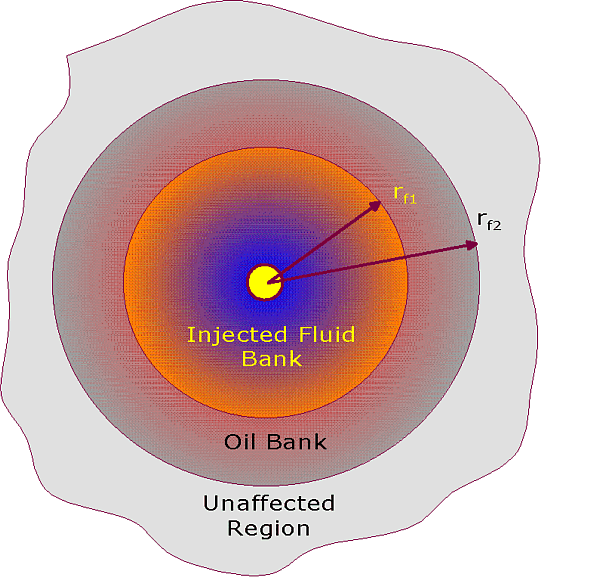
Figure 2 is a plan view of the saturation profile and reinforces the assumptions, for the cases discussed first, that the flow is radial.
|
| Figure 2. This is a schematic saturation profile that is consistent with Buckley Leverett displacement concepts - radial flow - top view. |
What is Mobility?
Mobilities are defined as:

|
The mobility ratio is defined as (at any saturation):

|
What are Injectivity and Falloff Tests?
In an injectivity test, the well is shut-in until the pressure is stabilized and then injection is begun at a constant rate while recording the bottomhole pressure. If the injected fluid has exactly the same properties (density, viscosity, compressibility, and wetting characteristics) as the reservoir fluids, an injectivity test would be identical to a pressure drawdown test except that the constant rate, q, would be negative. If only the density differs from that of the reservoir fluid and the reservoir is homogeneous, the injection profile would be uneven. The injected fluid will sink or ride over the reservoir fluid and the net pay, h, which should be used in the interpretation would not be the same as the net pay. If the viscosity and/or the compressibility and/or the wetting characteristics are different from those of the reservoir fluids, an interface or front will form in the reservoir between the injected and the reservoir fluids and the permeability will depend on the saturation - relative permeability is important.
A pressure falloff test is usually preceded by a long injectivity test. Injection is then stopped while recording pressure. Therefore, a pressure falloff test is similar to a pressure buildup test, but only if the properties of the injected and reservoir fluids are the same. In some falloff tests, the pressure at the wellhead goes on vacuum. When this happens, the level in the tubing drops and the wellbore storage coefficient changes. To avoid this situation, bottomhole shut-off is required or it is necessary to run a two-rate falloff test. In a two-rate falloff test, the injection rate is changed from q1 to q2 while recording pressure. If the injected fluid is the same as the reservoir fluid, conventional production well multi-rate falloff analysis can be used. Alternatively, if the injected fluid is not the same as the reservoir fluid but the injected fluid has already filled a substantial region around the well, a falloff or two-rate falloff, preceded by a short injectivity test can be equivalently interpreted - the position of the front cannot be determined.
Are There Analytical Solutions?
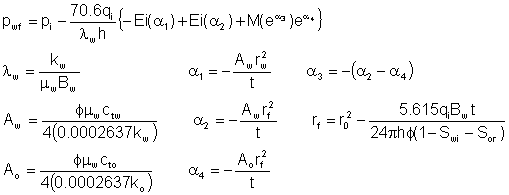
Yes! For the not-too-faint-at-heart, the solution for injection is:
|
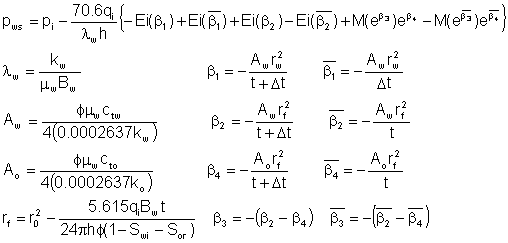
and the solution for falloff is:
|
As you can imagine, there are some fairly restrictive assumptions for these relationships. They include:
For Buildup in a Producing Well:
For a producing well, the well is initially flowed and then it is shut-in and the pressure is allowed to build up - the pressure builds up because it is recovering from the reduced pressure during drawdown and associated production. The injection analog is the falloff test, described later.
Case 1: During the Infinite Acting Period:
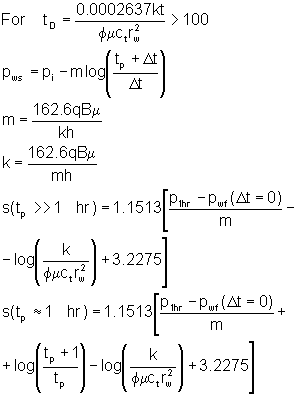
where:
| tD is the dimensionless time | t is the time (hours) |
| p1hr is the pressure on straight line portion of a Horner plot at a Horner time of 1 (psi) | pi is the initial pressure (psi) |
| m is the slope on a Horner plot determined after the end of storage, as shown on a log-log diagnostic plot | k is the permeability (md) |
| h is the thickness (feet) | m is the viscosity (cP) |
| q is the flowrate (sBBL/D) | B is the formation volume factor (rBBL/sBBL) |
| f is the porosity (fraction) | ct is the total compressibility (psi-1) |
| rw is the wellbore radius (inches) | pwf is the bottomhole pressure (psi) |
| s is the skin | tp is the flowing time (hour) |
| tp=24Vp/q' (caution is required) | Vp is the cumulative volume produced since last pressure equalization (bbl) |
| q' is the constant rate just before shut-in (bbl) | |
Case 2: Finite Reservoir (Horner)
The Horner plot is generally not used unless tp < tpss (the time at which pseudo-steady-state flow starts). The procedure is identical to the infinite analysis except that p* is used in place of pi.
Case 3: Finite Reservoir (MDH)
If Dt << tp, replace the Horner time with logDt and estimate the false pressure in the same manner as for the Horner plot. In either analysis, the time to the start of the semi-log straight line can be estimated as:

where:
| C is the wellbore storage coefficient (bbl/psi) | s is the skin |
| p is the pressure (psi) | t is the time (hour) |
| q is the flowrate (sBBL/D) | k is the permeability (md) |
| h is the thickness (feet) | m is the viscosity (cP) |
| B is the formation volume factor (rBBL/sBBL) | |
The end time for the semi-log straight line is:
![]()
where:
A is the area (ft2)
(DtDA)esl is the dimensionless time at the end of the semilog straight line (tabulated for various reservoir shapes)Case 4: Developed Reservoir:
When the test well is producing at pseudosteady-state before a buildup test or when there is pressure decline because of production from other wells, alternate methods should be applied. (refer for example to Earlougher, 1977).
Case 5: Infinite Acting, Unfractured Reservoir With Variable Rate Before Testing:

If the production rate is very much shorter than the shut-in period:
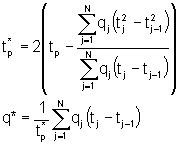
where:
q* is the total stock tank volume produced.
Normal Horner analysis is used with tp* and q* is used instead of tp and q.
Injectivity Test in a Liquid-Filled Reservoir in an Injection Well with Unit Mobility:
This is a situation where the mobility of the injected fluid is essentially equal to the mobility of the in-situ fluid. This is analogous to production well drawdown testing with the exception that q < 0 for injection and q >0 for production. If the exponential integral is approximated with a logarithmic term, presuming long enough time, the pressure relationship can be expressed as:

For a constant rate injectivity test:

where:
m is the slope on a plot of bottomhole pressure versus the log of time (psi/hr) determined after the end of storage as shown on a log-log diagnostic plot.
pwf is the bottomhole pressure (psi) p1hr is the pressure on straight line portion of a semilog plot one hour after beginning of the test - i.e., this is the pressure extrapolated to one hour on a plot of pressure versus logt (psi)When you do extrapolations on the semilog plot, you need to be sure that you are using the correct straight line. The start of the correct semi-log linear section can be estimated from:

where:
| s is the skin (dimensionless) | C is the wellbore storage coefficient (BBL/psi) |
| k is the permeability (md) | h is the thickness (feet) |
| m is the viscosity (cP) | q is the flowrate (sBBL/D) |
| B is the formation volume factor (rBBL/sBBL)> | t is the time (hour) |
| p is the pressure (psig) | |
The permeability and the skin are determined as:

where:
| p1hr is the pressure on the appropriate straight line portion of a semilog plot one hour after beginning of the test (psi) | pi is the initial pressure (psi) | |
| m is the slope on a plot of bottomhole pressure versus the log of time (psi/hr) determined after the end of storage as shown on a log-log diagnostic plot | k is the permeability (md) | |
| h is the thickness (feet) | m is the viscosity (cP) | |
| q is the flow rate (sBBL/D) | B is the formation volume factor (rBBL/sBBL) | |
| f is the porosity (fraction) | ct is the total compressibility (psi-1) | |
| rw is the wellbore radius (inches) | ||
Notice, as shown above, that wellbore storage effects can be significant during some injection tests. The wellbore storage is estimated from a log-log plot of pressure difference versus early time. The wellbore storage effects will die out 1.5 cycles after the start of deviation from straight line.
The radius of investigation and the distance to the water bank are:
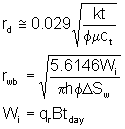
where:
| rd is the radius of investigation (feet) | rwb = rf is the radius of the water bank (wb) or the front (f) (feet) |
| k is the permeability (md) | t is the time (hour) |
| f is the porosity (fraction) | m is the viscosity (cP) |
| ct is the total compressibility (psi-1)> | Wi is the total injected volume (rBBL) |
| qr is the injection rate (rBBL/D) | B is the formation volume factor (rBBL/sBBL) |
| tday is the total injection time (days) | |
Injection Well Falloff Testing for Liquid-Filled, Unit Mobility Ratio Reservoirs:
For both infinite-acting and developed reservoirs, and a unit mobility ratio, a simplified falloff analysis, is possible by plotting pressure versus log([t + Dt]/Dt), the Horner time. As indicated below, a conventional plot of shut-in pressure against Horner time should give an early slope, m, and an extrapolated (false) pressure, p*.

For an infinite-acting system, the false pressure, p*, is equivalent to the initial pressure, pi. It can be determined from a Horner plot. The straight line portion is extrapolated to a Horner time of 1. The slope of the plot is –m.
![]()
Evaluate the log-log diagnostic plot to be certain that the correct straight line is used. The beginning of the semilog straight line for falloff testing can be estimated (although judgment from a log-log plot is preferred):
![]()
The permeability and skin are determined from the slope of the correct semilog straight line.

If the injection rate varies before the falloff test, an equivalent injection time is approximated as:
![]()
where:
Vp is the cumulative volume injected since the last pressure equalization (sBBL)
q is the constant rate just before shut-in (sBBL/D)Certain precautions are required in selecting the equivalent injection time (refer to the section on Buildup).
MDH techniques can also be used. The difference is that the abscissa is the logarithm of time since shut-in.
Shutting in the well does disturb steady-state conditions (if they existed) around the well in the reservoir and adjacent producers will eventually cause pressure decline in the test well. The pressure does not level off in a falloff test as it would for a buildup test. Ultimately, the pressure will decline below the semilog straight line due to this interference - actually, data in a pressure buildup in an injection test will deviate above the semilog straight line when injection at adjacent wells continues. Under these circumstances, developed reservoir considerations are required.
Multi-Rate Testing
Multi-rate falloff testing may be performed. Two-rate testing can be done to eliminate changing wellbore storage during a falloff test. A two-rate falloff is run by injecting at a relatively high rate (but not fracturing) and then decreasing the injection rate while observing the decrease in pressure. If rates are controlled, surface pressure is maintained and changing wellbore storage effects are eliminated. This is important because wells can go on vacuum during falloff testing and wellbore storage increases. These data are analyzed like a two-rate production test. The data are plotted as pressure vs. {log[(t1 +Dt)/ Dt] + (q2/q1)log Dt}:

where:
pint is the intercept pressure (psi)
If appropriate, use:
![]()
where:
"1" indicates the first rate and 2 indicates the second. Analysis is then conventional:
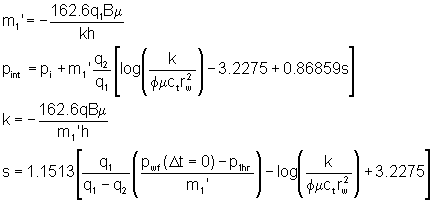
The false pressure is:
![]()
Injection Well Falloff Testing for A Composite Reservoir:
This is a very simplified discussion of an approach that may be taken.
![]()
![]()
Injection Test for a Non-Unit Mobility Ratio:
The unit mobility ratio case will apply approximately when the oil and water viscosities (and more generally the mobilities at Sor and Swi) are similar. In well developed injection scenarios, when short tests are conducted to evaluate changes in skin, and the radius of investigation does not exceed the radius of invasion, the unit mobility case will also be adequate. In other cases, it may be necessary to consider the effect of mobility change at the radius of invasion. There are some possible simplifications, for order of magnitude operations. A plot of the bottomhole pressure, pwf versus logt will theoretically yield three linear sections (although it is unusual for them all to be evident. Wellbore storage will also often be evident. The three characteristic slopes are as follows:
![]()
![]()
![]()
Pressure Falloff for a Non-Unit Mobility Ratio:
A Horner plot will have two straight line segments. The early time section reflects the mobility of the water bank and has a slope of:
![]()
When this first slope starts to depart from linearity can be an indication of the distance to the front:
The late time section reflects the mobility of the oil zone and has a slope of:
![]()
An Example - Non-Unit Mobility:
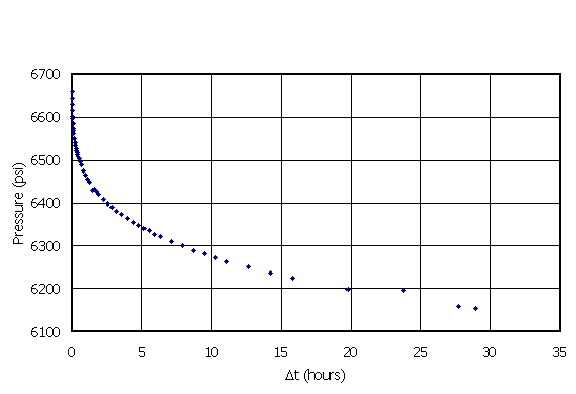
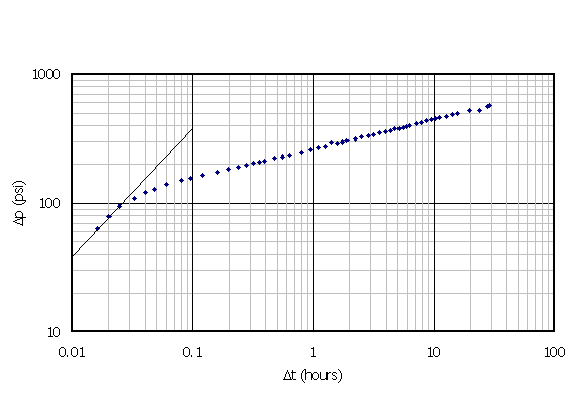
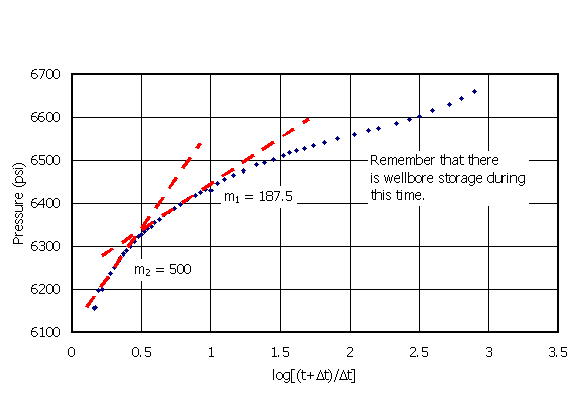
Daltaban and Wall provided an illustrative example. It is repeated here. 10,000 sBBL of water were injected into a well for ten days. A falloff test was then carried out. The pressure-time data after shut-in are shown in Figure 3. The injection rate immediately before shut-in was 780 sBBL/hr = 18,720 sBWPD. This reservoir has a porosity of 15%, a thickness of 100 feet, a residual water saturation of 30% and Bw = 1.02 rBBL/sBBBL. The compressibilities are Cw = 3.5 x 10⁻⁶ psi-1, Co = 12 x 10-6 psi-1, and, Cf = 2.5 x 10⁻⁶ psi-1. The viscosity of the water is 0.4 cP. The pressure prior to shut-in was 6724 psi and the water saturation behind the flood front was estimated to be 60%. The exercise is to estimate the distance to the radius of the flooded area.
|
| Figure 3. The variation of pressure with time after the well was shut-in for the falloff test. |
|
| Figure 4. Diagnostic plot. This is a log-log plot of the difference between the pressure at shut-in and the pressure at any time after shut-in versus the amount of time since the well was shut-in. |
|
| Figure 5. Horner plot. |
|
|

|

|
|
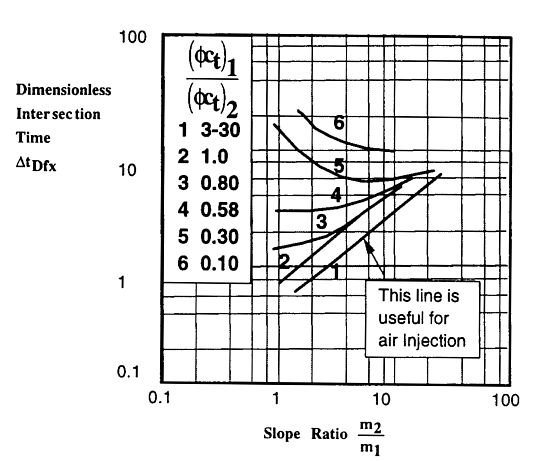
| Figure 6. Correlation for the dimensionless intersection time (after Merrill, Kazemi and Gogarthy, 1974). |
|
|

|
Example: A Two-Rate Falloff Test
This is an example taken from Earlougher, 1977. It is for a liquid-filled, unit mobility situation. An injectivity test was started in a reservoir that was a PWRI target. After injecting for a few hours, it was determined that a rate of -5000 STB/D could not be sustained without fracturing the reservoir. At this point in time, it was not desirable to fracture the reservoir. Consequently, the rate was reduced. There was a bottomhole pressure gauge. The variation of the pressure data with time is shown in Figure 7. The pumping at -5000 sTBPD lasted for only 371 minutes (6.183 hours). This rate was reduced to -2425 sBPD at that time. Assume that Bw is 1.0 rBBL/sBBL, the water viscosity is 1 cP, the thickness is 20 feet, the wellbore radius is 0.39 feet, the porosity is 20% and the total system compressibility is 7 microsips. The pressure when the rate changed is 8318 psi and p1hr is 6231 psi.
In Layered Reservoirs
Fractured Injectors
Larsen and Bratvold, 1990, modified the work of Bratvold and Horne, 1990, for radial flow, to cover flow in elliptic systems and extended this work to account for a propagating fracture. The model includes convective heat transfer as well as effects of relative permeabilies. Solutions to both the injection and falloff problems are derived using the quasi-stationary method.
Their approach was similar to that adopted by Koning and Niko, 1985, except that more general multizone elliptic models are allowed and the the pressure transient behavior under various propagation models are considered in more detail.
Larsen and Bratvold demonstrated their concepts using a simplified model for fracture initiation and propagation. They considered fracture propagation under constant rate injection to be given by the expression.
If pf > pi, a step change in fracture length will occur (unless a = 0). It is necessary to consider pressure, saturation, and temperature profiles at each time step in order to couple the propagation model more directly to the injection process.
These authors argued that it may be possible to include changes in saturation and temperature profiles and well and fracture geometries if the changes are sufficiently slow - using quasi-stationary models where the solution at time t is determined by assuming conditions in the reservoir to have existed in the reservoir from the beginning, without taking the history of changes into account. This has worked for isothermal and nonisothermal radial flow simulations. These authors used dimensionless parameters:

All fractures were assumed to have infinite conductivity. The fracture propagation model adopted was expressed as a dimensionless half-length with a dimensionless fracture propagation parameter.

pDf is the dimensionless fracturing pressure which is reached at tf. Consider first single phase conditions – injected fluid has the same properties as the displaced reservoir fluid. Standard solutions for radial flow can be used until the dimensionless wellbore pressure reaches pDf. Using the simplified propagation function shown above and assuming the validity of the quasi-stationary approach,the dimensionless wellbore pressure is:

They generated the radial flow data using a simple logarithmic model and the fracture flow data were developed by the model presented by Kuchuk and Brigham for a degenerated wellbore ellipse. To modify for falloff periods you need to set:

You should also be familiar with the work of Ovens and Niko, 1993. "The model gives the useful result that the traditional square root time plot can be used to precisely locate the pressure at which fracture growth begins and over a limited period of time to estimate the early rate of fracture growth."
These authors evaluated preceeding literature and felt that none of the solutions covered both transient pressure response of a growing fracture with a fracture propagation law and the effect of potentially large stress changes.
They combined:
Fracture Propagation Law: They used basic fracture toughness relationships for a uniformly pressurized plane strain fracture and accounted for changes in stress due to temperature and pressure. Koning published on the changes in stress due to steady-state changes in temperature and pressure in a fractured elastic medium, where there is no displacement perpendicular to the plane of the fracture. Ovens and Niko used boundary element considerations and found a solution that reduces to an integral over the fracture face S. Apply a uniform and constant leakoff and darcy's law a relationship was developed - must be changed for appropriate early time-dependence. If a rectangular fracture is assumed with zero width there is an analytical solution - it was given.
Change in Pressure:They used the so-called tri-linear model of Lee and Brockenbrough and introduced an extra set of boundary conditions to enable the effect of the different mobilities and diffusivities of the virgin oil and the fully swept waqter regions to be included. "Ideally, the geometry of the flood front would be that of an ellipse, but material balancfe considerations indicate that because of fracture propagation the water front lies parallel to the plane of the fracture, acting like a thin film on the fracture face. Therefore we can replace the elliptical geometry by a rectangular one for most practical testing times."
They used the "quasi-stationary" approximation to solve the problem in the case of a growing water injection fracture, implicitly assuming that the rate of fracture propagation is small compared to the rate of propagation of the pressure front.
Many of the analyses date back to work by Knoning (see, for example, Koning and Niko, 1985). "Pressure transient theory fo a water-injection well in the presence of a closing fracture and a discontinuity in fluid mobility [was] developed in elliptical coordinates. Solutions [were] obtained using the Laplace transform and numerical inversion. From the results it is concluded that a pressure falloff test with a closing fracture in principle provides three different methods for determining the fracture length." - based on rock mechanics principles, looking at formation linear flow and looking for the transition of the pressure transient from the inner fluid region to the outer region in conjunction with a heat or volume balance.
They cited that:
You should especially note their methodlogy for treating a fracture during closure. The closing fracture behaves as a compressible system. They outlined procedures for interpreting a pressure falloff test in the presence of a closing fracture.
Fracture length estimates are possible. Testimony from Maersk (Ohrt, personal communication, 2001) has indicated that this appears to work well in the chalk formations where they routinely use it.
References:
|
|
|
|
|