What is/are
Fiber Optics?
Fiber Optics encompasses the transmission of light through fibers or thin
rods of glass or some other transparent material with a high refractive
index. Light that enters one end of a
fiber can travel through the fiber with very low loss, even if the fiber is
curved. Images can be transmitted, as
can data. The fiber optics itself can
be used as a sensor for variations in environmental parameters such as
temperature and pressure.
The Principle -
Total Internal Reflection
Light traveling
inside the fiber center (core) strikes the outside surface at an angle of
incidence that is greater than the critical angle. Consequently, all this light is reflected toward the inside of
the fiber without loss. Light can
therefore be transmitted over long distances by being reflected inward
thousands of times. In order to avoid
losses through the scattering of light by impurities on the surface of the
fiber, the optical fiber core is clad with a glass layer of much lower
refractive index and the reflections occur at the interface of the glass fiber
and the cladding. This avoids losses
caused by scattering of light by impurities on the fiber surface.
Bundles of several
thousand very thin fibers assembled precisely side by side and optically polished
at their ends can be used to transmit images.
Each point of the image projected on one face of the bundle is
reproduced at the other end of the bundle, reconstituting the image, which can
be observed through a magnifier. Image
transmission by optical fibers is widely used in medical instruments for
viewing inside the human body and for laser surgery, in facsimile systems, in
phototypesetting, in computer graphics, and in many other applications.
Instrumentation:
Optical fibers are
used in numerous sensing devices, ranging from thermometers to gyroscopes. The transmitted light is sensitive to
environmental changes, including pressure, sound waves, and strain, as well as
heat and motion. The fibers can be
especially useful where electrical effects could make ordinary wiring useless,
less accurate, or even hazardous.
Fibers have also been developed to carry high-power laser beams for
cutting and drilling. Petroleum
applications include sensors.
Communication:
In addition to
sensing environmental variations, fiber optics can be used to transmit the
measurements to the surface. Because
the information-carrying capacity of a signal increases with frequency, the use
of laser light offers many advantages.
Fiber-optic laser systems are being used in communications
networks. Long distances (100 km) can
be achieved before signal repeaters are needed to regenerate signals.
History of
Fiber Optics
While it may not be of critical need to you in your
day-to-day operations, the following chronology is light and informative
reading, documenting the exponentially accelerating technology.
·
Alexander Graham Bell patented an optical telephone
system, the Photophone, in 1880. Since
then, technologies that would make optical transmission possible have
developed.
·
In the 1840s, Daniel Collodon and Jacques Babinet showed
that light could be guided along jets of water for fountain displays.
·
British physicist John Tyndall popularized light guiding
in a demonstration he first used in 1854, guiding light in a jet of water flowing
from a tank.
·
By the 1900s, inventors realized that bent quartz rods
could carry light, and patented them as dental illuminators
·
During the 1920s, John Logie Baird in England and C.W.
Hansell in the United States patented the idea of using arrays of hollow pipes
or transparent rods to transmit images for television or facsimile systems.
·
In a 1930 paper, Heinrich Lamm demonstrated image
transmission through a bundle of optical fibers. He reported transmitting the image of a light bulb filament
through a short bundle.
·
In 1951, Holger Møller Hansen applied for a Danish patent
on fiber-optic imaging. It was denied, citing the Baird and Hansell patents.
·
In 1954, A. van Heel (Technical University of Delft) and
H. H. Hopkins and N. Kapany (Imperial College) separately announced imaging
bundles in Nature. These bundles
could not carry light far. All earlier
fibers were "bare," with total internal reflection at a glass-air
interface. van Heel covered a bare
fiber of glass or plastic with a transparent cladding of lower refractive
index. This protected the total
reflection surface from contamination, and greatly reduced crosstalk between
fibers.
·
L. Curtiss (University of Michigan) developed glass-clad
fibers while working on an endoscope to examine the inside of the stomach (with
physician B. Hirschowitz, and physicist C.W. Peters).
·
W. Hicks, (American Optical Co.) made glass-clad fibers at
about the same time, but his group lost a bitterly contested patent battle.
·
By 1960, glass-clad fibers had attenuation of about one
decibel per meter. This was adequate
for medical imaging, but much too high for communications.
·
Telecommunications engineers were seeking more
transmission bandwidth (e.g., A. Reeves, at Britain's Standard
Telecommunications Laboratories).
·
The invention of the laser in 1960 brought more converts.
·
Serious work on optical communications accelerated with
introduction of the continuous wave helium-neon laser.
·
By 1965, it was clear that major technical barriers
remained for both millimeter-wave and laser telecommunications. Millimeter waveguides had low loss, although
only if they were kept precisely straight; developers thought the biggest
problem was the lack of adequate repeaters.
Optical waveguides were proving to be a problem. S. Miller's group at Bell Telephone
Laboratories was working on a system of gas lenses to focus laser beams along
hollow waveguides for long-distance telecommunications.
·
Optical fibers were shown to be analogous in theory to
plastic dielectric waveguides that were used in certain microwave
applications. In 1961, E. Snitzer
(American Optical Co.) and W. Hicks (Mosaic Fabrications, now Galileo
Electro-Optics) demonstrated the similarity by drawing fibers with cores so
small that they carried light in only one waveguide mode.
·
C.K. Kao (Standard Telecommunications Laboratories)
evaluated fiber attenuation. He
collected samples from fiber makers, and carefully investigated the properties
of bulk glasses. His research convinced him that the high losses of early
fibers were due to impurities, not to silica glass itself.
·
Kao and G. Hockham conceived methods for long-distance
communications over single-mode fibers (with fiber loss below 20 decibels per
kilometer) - a glass core about three or four microns in diameter, clad with a
coaxial layer of another glass having a refractive index about one percent
smaller than that of the core. Total
diameter of the waveguide is between 300 and 400 microns. Surface optical waves are propagated along
the interface between the two types of glass – flexible but strong.
·
F. F. Roberts, at the British Post Office Research
Laboratory raised a new research fund of 12 million pounds to study ways to
decrease fiber loss.
·
At the Corning Glass Works (now Corning Inc.), R. Maurer,
D. Keck and P. Schultz started with fused silica, a material that can be made
extremely pure, but has a high melting point and a low refractive index. They made cylindrical preforms by depositing
purified materials from the vapor phase, adding carefully controlled levels of
dopants to make the refractive index of the core slightly higher than that of
the cladding, without raising attenuation dramatically.
·
In September 1970, they announced they had made
single-mode fibers with attenuation at the 633-nanometer helium-neon line below
20 dB/km.
·
In the same year, Bell Labs and a team at the Ioffe
Physical Institute in Leningrad made the first semiconductor diode lasers able
to emit continuous waves at room temperature.
Over the next several years, fiber losses dropped dramatically, aided
both by improved fabrication methods and by the shift to longer wavelengths
where fibers have inherently lower attenuation.
·
Early single-mode fibers had cores several micrometers in
diameter, and in the early 1970s that bothered developers. They doubted that it would be possible to
achieve the micrometer-scale tolerances needed to couple light efficiently into
the tiny cores from light sources, or in splices or connectors. Not satisfied
with the low bandwidth of step-index multimode fiber, they concentrated on
multi-mode fibers with a refractive-index gradient between core and cladding,
and core diameters of 50 or 62.5 micrometers.
The first generation of telephone field trials in 1977 used such fibers to
transmit light at 850 nanometers from gallium-aluminum-arsenide laser diodes.
·
Those first-generation systems could transmit light
several kilometers without repeaters, but were limited by loss of about 2 dB/km
in the fiber. A second generation soon appeared, using new InGaAsP lasers which
emitted at 1.3 micrometer, where fiber attenuation was as low as 0.5 dB/km, and
pulse dispersion was somewhat lower than at 850 nm. Development of hardware for
the first transatlantic fiber cable showed that single-mode systems were
feasible, so when deregulation opened the long-distance phone market in the
early 1980s, the carriers built national backbone systems of single-mode fiber
with 1300-nm sources. That technology has spread into other telecommunication
applications, and remains the standard for most fiber systems.
·
However, a new generation of single-mode systems is now
beginning to find applications in submarine cables and systems serving large
numbers of subscribers. They operate at 1.55 micrometers, where fiber loss is
0.2 to 0.3 dB/km, allowing even longer repeater spacings. More important,
erbium-doped optical fibers can serve as optical amplifiers at that wavelength,
avoiding the need for electro-optic regenerators. Submarine cables with optical
amplifiers can operate at speeds to 5 gigabits per second, and can be upgraded
from lower speeds simply to changing terminal electronics. Optical amplifiers also are attractive for
fiber systems delivering the same signals to many terminals, because the fiber
amplifiers can compensate for losses in dividing the signals among many
terminals.
Excerpted and modified from Fiber Optics
Technician's Handbook, by Jim Hayes, Delmar Publishers, Albany, New York
and Laser Focus World (November 1994).
See also City of Light: The Story of Fiber Optics, Oxford
University Press, New York, 1999. (ISBN 0-19-510818-3) and http://www.sff.net/people/Jeff.Hecht/history.html.
Petroleum Applications of Fiber Optics
(Excerpted from Wright, P.J., “Optical fiber's gigabit bandwidth, 200 km range attractive for subsea work.” Offshore Magazine (May 2000).
Up until now, optical fiber use in the petroleum
industry has been somewhat limited to applications supporting technology that
cannot function with "standard" electrical communication (to provide
communication where high levels of electrical noise prevent the use of
copper-based communication), for direct access to optical sensors (subsea and
downhole) and for communication with sensor systems providing either continuous
real-time data, or information at data rates higher than can be supported by
existing electrical communication.
Fiber optics continues to provide a flexible enabling technology for
future subsea oilfield development
“The resulting growth in control systems
functionality and update rates is pushing the need for increased communication
bandwidth, and the need for more flexible and fault tolerant communication
systems using bus architectures. The
search for improved profitability is also driving the development of new and
improved subsea and downhole sensors and sensor arrays.”
Platform-to-Platform Communications
Until 1996, fiber optics were used offshore only
for communication between adjacent platforms.
The Dunbar Platform is operated from the North Alwyn Platform, 22 km
away. The fiber optic link is provided by two continuous power umbilicals
connecting the platforms. Nowhere in this system is there access to the fibers
subsea.
Subsea Machinery
The electrical noise environment around new subsea
production techniques (e.g. subsea separation, multiphase pumping), and the
power umbilicals that supply them, are problematic for conventional electrical
communication and have driven the move to inherently noise immune, fiber optic
communication configured for the modular offshore installation.
Well Diagnostics
In the North ETAP development, Shell has
permanently installed downhole, passive optical sensor heads that were tied
back to their drive and diagnostics system located on the Marnock platform 25
km from the furthest well.
Umbilical Cross-Section
“Some recent deepwater development programs have
realized significant financial advantages using optical fiber in place of
copper. Studies have shown that the
forecast umbilical construction and installation cost show significant CAPEX savings
particularly for deepwater installation.
Construction savings arise from the reduction in cross-section in the
umbilical core that comes from removal of multiple copper communication lines,
and their replacement by one or two fiber elements. This saving is then compounded by the reduced amount of armoring
needed for the smaller core.
“Reduced installation costs come from the decreased
cross-section and weight per unit length of the umbilical, and therefore the
maximum length that can be installed in one piece. Where the increase in length
results in the removal of, or reduction in, the number of umbilical mid-span
joints, then the installation costs are reduced even further. With the
umbilical costs being one of the main drivers in overall program am economics,
the significant cost reductions that may be possible with a fiber optic option
can result in the decision to develop a marginal field.”
Critical Technology
Throughout these advanced programs, the critical
technology was the development of the first low optical loss wet mate fiber
optic connector. Without this, the modular installation of these and many other
systems could not have moved ahead.
Communication
Historically, electrical communication for subsea
control and data acquisition has been limited to 1,200 bit/sec, with anything
up to 400 bit/sec being used for control system housekeeping functions.
Consequently, the update rate for production related data has been slow by
normal industrial standards, where typically Ethernet type systems are now
being employed. This is particularly noticeable where a number of subsea
control modules (SCM's) are interrogated sequentially through a topside control
system that uses a single modem. By comparison, a single digital telephone
conversation requires 64 Kbit/sec.
Fault Tolerant Systems
“Fault tolerant systems will feature heavily in the
expansion into ultra-deepwater, as remotely operated vehicle (ROV) configurable
and retrievable equipment become standard.
This will include modular control systems, ROV installable valves and
chokes, and the position sensors associated with them, as well as specialized
sensors for fiscal metering and multi phase flow measurements, directly
addressed through the optical fiber.”
“The Gulf of Mexico has just seen the installation
of the first high bandwidth (2.5 Gbit) telecommunications cable solely for the
use of offshore platforms. This "fiber web" link installed by
PetroCom, for the first time provides the opportunity to directly control or
monitor the performance of a subsea (or downhole) system from the office
desk. This technology currently offers
more reliable, versatile, and cost-effective, communication than the existing
cellular and microwaves options. The
Fiber Web system runs from Freeport, Texas via seven offshore platforms to
Fourchon, Louisiana, and completes the ring on land through New Orleans and
Houston.”
Subsea Production
Multiphase pumps, and/or subsea separation systems,
which themselves will benefit from a high bandwidth controls and condition
monitoring system, and where high power electrical motors are included, the
noise immune performance of optical fiber simplifies the prevention of data
corruption on the communication lines.
Norsk Hydro installed the Troll Pilot subsea
separator system late last year. This system, built by ABB Offshore, includes a
2 MW pump to pressure boost the wastewater for re-injection. All communication
on this system is by optical fiber.
Petrobras has developed a deepwater (1,000 meters
water depth) compatible multiphase pump that communicates with the surface over
a fiber optic link built into the power umbilical to the motor. A number of other separator and multiphase
pump programs such as Total's Nautilus multiphase pump program, and the CoSWaSS
(configurable subsea water separation system) joint industry project have also
concluded that fiber optic communication is necessary for secure, error-free
communication.
Technology to produce slim-line hydrocyclones,
capable of installation in a wellbore, is under development. The pumps needed to dispose of wastewater through
a lateral, or for production boost already exist. Control and monitoring technology for these systems will require
environmentally robust, high bandwidth noise immune communication, using
downhole fiber optic cables and connectors.
The various produced fluids will need high bandwidth sensors such as
photo acoustic oil-in-water sensor technology, which are already in development
for oil-in-water measurement for production optimization. Effective equipment wear monitoring will be
necessary to allow scheduled replacement, and minimize rig activation costs.
Sensing Applications
Optical fiber offers the next major step change in
sensor technology for the subsea and downhole arenas. Optical fiber sensors can
he used to measure effects such as:
·
Position and movement with fiber gyroscopes
·
Acoustics with fiber hydrophones
·
Strain in "smart structures"
·
Chemicals and reactions
·
Electrical supply characteristics.
Fiber will be used to provide high bandwidth,
electrical noise immune, environmentally stable communication with multiplexed
sophisticated subsea and downhole equipment.
Optical fiber will also provide communication to a range of discrete
passive optical sensor heads, measuring temperature, pressure, flow, and vibration.
The fiber itself can be used as a distributed
sensor, using either the Brillouin or Raman scattering effects, inherent in all
fiber. It is currently possible to
measure temperature and strain over fiber lengths of up to 30 km. This technology, already in use to measure
temperature distribution in land-based wells, can also be used to monitor
continuous pipeline temperature from the well to the platform and provide early
warning of waxing or hydrate formation, or monitoring of pipeline temperature
change during a shut-in.
“Discrete multiplexed sensor elements can be
written directly onto glass fiber using an intense UV light source. These are
known as Fiber Bragg Gratings (FBG), and reflect only the frequency of light
which matches the grating pitch, so any parameter need only cause a change in
length of a fiber section containing a grating to cause a shift in the
reflected wavelength.”
It is possible to construct networks of Bragg
gratings to measure temperature, pressure, strain, vibration, and acoustic
signals over a single fiber. The change
in reflected wavelength, indicating the change in an environmental parameter,
can be detected by coupling a "white" light source onto the
fiber. The reflected signals are for
any wavelength shift from a calibrated value.
The source and detection equipment can be located
some distance from the well, and linked by optical fiber and fiber optic
connectors. Temperature, pressure, and
other parameters can be accurately recorded.
Optical fiber can also be used to sense passive,
discrete sensor elements. These often include a cavity whose length is modified
by the parameter of interest, which results in a change in the optical signal
picked up by the optical fiber. Shell
ETAP’s program uses this type of detection - FOWM (fiber optic well
monitoring).
“The move into ultra-deepwater brings with it the
need to implement structures using lightweight composite and smart
materials. Many composite material
manufacturers are experimenting with Bragg Grating encoded glass fiber bedded
directly into the composite matrix, so that the gratings form a sensor net
capable of measuring loading in any direction of interest. This "smart composite" material
technology is being investigated by the offshore industry to support the
construction of many lightweight structures.”
Examples include drilling and production risers as well as composite
tension legs and tethers.
Environmental Tolerance
In comparison to electrical equipment,
survivability in the subsea and downhole environments, with contact with water
is superior.
The glass fiber will tolerate temperatures above
1,000oC. Polyamide coated
cable assemblies will survive 600oC. The fiber should be protected inside a hermetically welded,
buffer gel filled tube. This tube can
be housed within a second hermetically welded tube with support wires. The final tube diameter is ~1/4-in. in
diameter, and this can be used with production tubing.
Cost
Currently, the cost of single mode fiber (about 5
cents/ft) and a twisted shielded pair copper (30 cents/ft for 18AWG twisted
shielded pair cable) are cost comparable, and it should be expected that the
pricing would be even more favorable.
Strength
Under tension optical fiber has strength equivalent
to steel. There is little resistance to
shear and careful handling is required when the fiber is not protected in a
cable or jumper. As a cable element,
the fiber element can be handled with the same equipment and techniques as any
other element that is being built into an umbilical.
Hydrogen Darkening
Hydrogen ions, naturally present at low partial
pressures or from more corrosion, or a cathodic protection system, can be
absorbed by glass fiber. This causes
increased attenuation. This effect is
only of interest where long lengths (kin) of fiber are involved.
Properly designed umbilicals keep out hydrogen
since they are in hermetically welded steel or copper tube, filled with a
buffer gel that has hydrogen adherence properties. Alternatively, the fiber can be run through a non-corrosive
jumper, such as thermoplastic hose.
Carbon coated fiber can also be used.
A reference is Lemaire, P.: “Reliability of Optical
Fibers Exposed to Hydrogen: Prediction of Long-Term Loss Increases,” Optical
Engineering 30(6) (June 1991) 780-789.
More on
Optical Sensors
(Excerpted from Williams, G.:
“Optical sensing coming of age in production monitoring.(Petroleum Production
Engineering” Offshore Magazine (January, 1999).
Background
Probably the first commercial fiber optic pressure
sensor was developed through a joint industry program between Norsk Shell and
Alcatel Kabel Norge with BP Norway and Norsk Hydro as co-sponsors to offer
permanent downhole pressure and temperature measurement and to be capable of
operating in HP/HT environments (120 to 150oC).
What is an Optical Sensor?
It is a micro-machined silicon oscillator that is
activated and read optically through a single fiber. The fiber's resonant frequency varies with the pressure and
temperature downhole. It is practically
insensitive to fluctuations in signal attenuation and can be operated remotely. Over five of these systems have so far been
installed.
A system developed by Sensor Highway of Andover, UK
deploys optical sensors using a conduit concept. This allows thin filament sensors to be placed in the well using
fluid drag and has certain intrinsic advantages.
·
Downhole splices in the optical fiber are not required
·
Sensors can be installed at any time, even after
completion
·
Faulty sensors can be replaced or upgraded sensors can be
installed during the life of the well
·
Sensors can also be "buffered" using specially
formulated fluids that are placed in the conduit.
Optical
sensors’ inherent properties also provide:
- High sensitivity
- Electrical
passiveness
- Wide dynamic range
- Multiplexing
capability
Temperature
Measurement:
The Distributed Temperature Sensor (DTS) was
developed for short range (monitoring 1.5 km) to long-range implementations up
to 30 km. Distributed temperature
sensing can be used to provide a real-time thermal profile along the entire length
of the well, enabling optimal inflow conformance through the detection of any
thermal event. Temperature data are
measured at every point along the line.
Laser light pulses are generated by the DTS and launched into the
optical fibre sensor. As the light pulse encounters temperature features along
the fibre the pattern of back-scattered light returning to the DTS changes.
Advanced signal processing within the DTS retrieves the temperature profile of
the fibre from the backscatter signal. Unlike
conventional instrumentation, the fibre optic system serves as both a sensor
and the means of transmission. The
Sensa distributed temperature system measures temperature along the whole
length of an optical fibre in real time.
With photons traveling at the speed of light through the fibre,
measurements can be made along the complete well without an intervention.
A surface laser sends a light pulse down the fibre
and a computer analyzes the back-scattered light from every meter interval of
the fibre – from the surface to well bottom and back. Temperature is calculated for
every meter along the fibre to an accuracy of 0.1°C and a resolution of 0.1°C.
Installation of Sensa’s fibre
optic distributed temperature system takes place while the well is being
completed using a special hydraulic installation technique licensed from
British Telecommunications plc.
The
temperature monitoring of complete well profiles in real time allows a thermal
signature of the well to be determined.
Subsequent changes in temperature can be used to identify and monitor:
- Flow profiling
- Injection monitoring
- Flow behind casing
- Gas lift efficiency
- Fracture zones
- Casing leaks and
channels
- Lost circulation
zones
- Cement top
identification
- Cement squeeze
validation
- Steam breakthrough
- Steam channeling
These data can be correlated with
information acquired on the surface - including flow rates and water cut - as
well as from openhole logs and tester data - resulting in qualitative and
quantitative information about the changes that are occurring downhole.
As indicated, distributed temperature
is measured by sending a pulse of laser light down the optical fibre. Molecular
vibration (which is directly related to temperature) creates weak reflected
signals. The reflected signal is detected in the surface read-out unit and
converted to values of temperature at 1-meter intervals along the fibre and
well. The temperature data can be displayed on-site, stored for later analysis
or transmitted in real-time via modem or scada/modbus links.
The distributed temperature system has two modes of operation, single
ended (SE) and double ended (DE).
Systems are designed and configured according to particular
applications.
Typical specifications are shown
below.
|
Spatial Resolution |
1.0
meters or 2.5 meters depending on the model |
|
Accuracy |
+/-
0.1oC +/- 1.0oC depending on the model |
|
Resolution |
+/-
0.1oC +/- 0.5oC depending on the model |
|
Light
Source |
Pulsed
Class 3 Laser |
|
Optic
fibre |
Multi-mode |
|
Temperature
Analysis |
Raman
back scattering |
|
Temperature
range |
-40° to +300° C |
|
Single
ended accuracy |
+/-
0.5° C |
|
Single
ended resolution |
+/-
0.5° C |
|
Double
ended accuracy |
+/-
0.1° C |
|
Double
ended resolution |
+/-
0.1° C |
|
Depth
increments |
1
meter |
|
Time
increments |
15
minutes plus |
|
Operating
Length/range |
<12
km |
Principles of Operation
DTS with optical fibers is based on optical time-domain reflectometry. A pulsed laser is coupled to an optical fiber that is the sensing element. The light is backscattered as the pulse propagates through the fiber owing to density and composition as well as to molecular and bulk vibrations. A portion of the backscattered light is guided back to the light source and split off by a directional coupler to a receiver. Under ideal conditions the intensity of the backscattered light decays exponentially with time. As the speed of the light within the fiber is known, the distance that the light has passed through the fiber can be derived from the time along the decay curve. (See Figure 1).
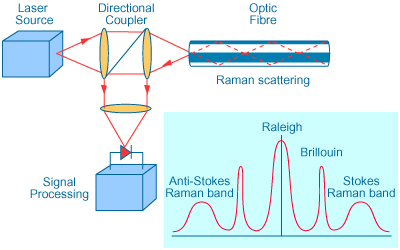
Figure 1. Schematic operation of a fibre optics
device.
The backscattered light includes
different spectral components; Rayleigh, Brillouin and Raman bands. The Rayleigh component is independent of
temperature but is useful in identifying breaks and inhomogeneities along the
fiber. This is the main tool used by
the telecommunications industry to check the condition of optical fiber
communication links. The Raman spectral
band is caused by thermally influenced molecular vibrations. These are naturally occurring phenomena in
glass as well as in fluids, gases and solids.
The Raman spectral band can be used to obtain information about
distribution of temperature along the fiber.
The Raman backscattered light has two components, Stokes and
Anti-Stokes, one being only weakly dependent on temperature and the other being
greatly influenced by temperature. The
relative intensities between the Stokes and Anti-Stokes are a function of
temperature at which the backscattering occurred. Therefore, temperature can be determined at a remote point in the
optical fiber (wave form is inset in Figure 1).
Precautions
It is crucial to avoid excessive
build up of either intrinsic or extrinsic energy losses in the optical
fiber. Intrinsic energy losses arise
from the scattering and absorption of the light in the optical fiber
medium. Connectors generate extrinsic
energy losses as do field splices, and fibers that have tight bends and
excessive heat or mechanical damage.
Excessive losses will lead to a gradual degradation in measurement range
or complete loss of signal in the extreme case.
Hydrogen Attenuation:
It has been recognized since
1982 that there are absorptive losses associated with hydrogen that is
dissolved in silica glasses. Due to its
small size, the H2 molecule, which may be present around an optical
fiber, can readily diffuse into the central light guiding region of the
fiber. Early accelerated laboratory
tests found that loss increases could occur due to hydrogen, which either
originated from polymeric materials or from galvanic corrosion cells in subsea
cables. Problems of this sort have been dealt with by:
(1)
Altering the fiber dopant composition
(2)
Redesigning the fiber cables to avoid the possibility of H2
generation, and
(3)
Using hermetic coatings to block the diffusion of any
hydrogen that might be present in the cable.
However, even when the problems associated with large short term losses are solved, there still remains the issue that there might be small but significant long-term loss increases due to the trace levels of hydrogen that can remain in fiber cables. Laboratory experiments to date suggest that with a well-manufactured optical fiber and good hermetic coating, ingress of hydrogen into the optical fiber only occurs at temperatures greater than 572 °F (300°C). At temperatures below this value, existing coating technology is capable of limiting hydrogen ingress to a level that does not result in fiber degradation. Fiber degradation is evidenced by a significant increase in attenuation through wave-guide darkening.
Liquid Ingress into the Fiber:
The ingress of liquids into
optical fibers can lead to both increases in fiber attenuation and eventual
mechanical failure of the fibers.
Fluids that pass into the fibers create absorptive losses in the wave guide
and create mechanical stress in the fiber, which leads to micro-bending
effects. Water is extremely damaging
to optical fibers. Water ingress,
if permitted will extend any surface cracks that may be naturally occurring in
the fiber surface and these will be elongated by a stress cracking
process. The diameter of the optical
fiber will be reduced to the point where it cannot support its own weight and
failure will occur. The use of hermetic
coatings in situations where the optical fiber is likely to be exposed to water
has been the traditional means of combating this problem.
Micro-bending:
Optical fibers also suffer
increased extrinsic energy losses due to micro-bending effects. Large bends of cable and fiber are
macro-bends and small-scale bends in the core-cladding interface are
micro-bends. Macro-bends rarely create
difficulties when optical fibers are deployed downhole. However, care is necessary to avoid forming
micro-bends particularly at temperatures in the region of 482 °F (250°C). Micro-bending can occur when stresses are
built up in the fiber coatings as either the fiber is heated or cooled. Probably, cyclical heating and cooling
offers the greatest challenge for optical fibers in respect to micro-bending
losses. Tests performed for Canadian
huff and puff operations indicate that there is severe micro-bending when the
fiber is returned to ambient reservoir conditions after being exposed to
temperatures as high as 644 °F. Further
optical fiber coating development will be required to take measurements
accurately across the full range of 86° - 644 °F.
In 1999, Carnahan et al.,
stated:
“Disadvantages of the fiber optic system when compared to the thermocouple bundle is the higher cost associated with the data acquisition system. System accuracy and resolution is a function of response time and several minutes are required to reach accuracy and resolution of 0.5 °F and 0.2 °F respectively. Finally, the relative fragility of the optical fiber can be a problem before it is placed in the control line.”
Installation
Installation of the Distributed
Temperature Sensor is “simple” - the well is equipped with a 1/4 inch O.D.
control line. This can be installed
either outside or inside casing/liners or screens. Specially coated optical fibre is then pumped into the control
line and connected to an opto-electronic surface read-out unit.
Standard oilfield procedures are used to equip the completion with the
control line. This can be either part
of a new well design or as part of a work-over schedule. Optical fibre is then placed into the
conduit using a hydraulic system under license from British Telecommunications
plc
The
apparatus for installation of the optical fibers is protected by US Patents
5022634 and 5199689 (and corresponding foreign patents). It has been manufactured under license from
British Telecommunications plc and is the property of Sensor Highway Ltd.
Installation
of Sensa’s distributed temperature fibre takes place either while the well is
being completed or once the completion is finished using a special hydraulic
installation technique licensed from British Telecommunications plc.
Unlike
permanently installed electrical sensors, the system has a high reliability
under extreme conditions and unlike conventional logging methods, there is no
risk to the well from the intervention or loss of production while the log is
being run.
The optic fibre is pumped around
a 1/4-inch control line that is installed during the well completion, or
workover. Over
10,000 meters of fibre have been successfully installed in control line in a
single well. The
control line can be installed either as a single line, or as two lines with a
Sensa designed Turn Around Sub at the bottom allowing both ends of the fibre to
be connected to the surface electronics. Double ended mode will give a more accurate temperature
measurement and is preferred if analysis of flow contribution over the
reservoir is required.
Figure 2. Distributed Temperature Implementation
To recap, devices
of this sort can:
·
Reduces production logging intervention and lost or
deferred oil production.
·
Simple & highly reliable monitoring tool that will
out-live the well.
·
Provides real-time TD-to-well head measurement of
temperature at 1 meter intervals with one compact optical fibre cable.
·
One sensor system provides information on in-flow
characteristics, gas breakout, artificial lift equipment and mechanical
integrity.
·
Sensor can be replaced if necessary without intervention.
Completion Configuration
Areas
that need to be considered for integration of the Sensa system with the
completion include:
·
Wellhead barriers provided by
Sensa to suit different environments and legislative requirements.
·
Wellhead modifications to
facilitate passage of the control line through the wellhead.
·
Tubing hanger modifications to
facilitate passage of the control line through the tubing hanger.
·
Clamps/straps are required to
protect the control line. Equipment ranges
from specialized clamps for protecting the control line on the outside of
horizontal gravel-pack screens to simple stainless steel bands to anchor the
control line to the outside of tubing or casing of shallow vertical wells.
·
On-off disconnect unit is required
if the completion is to be run in more than one trip. The on-off disconnect protects and orientates the two control
lines in the upper and lower portions of the completion.
·
Packer penetrators to allow
passage of the control line through packers.
·
Turnaround sub to allow smooth
controlled turn of the control line at the bottom of the instrumented
completion.
The
distributed temperature system surface readout has been designed as a modular
unit to provide up to 24 optical sensing channels. Each channel is dedicated to a particular temperature sensing
optical fibre that can be up to 12 km in length. Typically one channel is dedicated to a single well however
shallower vertical wells can be joined into one loop by running the fibers in
series down each well until the total length limitation has been reached.
The
distributed temperature data can be seamlessly integrated into existing DCS,
PLC or SCADA type systems for production control and monitoring. Working with
state of the art techniques including web-based delivery systems allows the
information to be placed at the desks of the people who need to make the
decisions.
Thermal
simulation models are used to match measured profiles with production
conditions and so provide valuable information on changing production
conditions without having to run a production log. Reservoir
Additional
references include:
1.
Osato, K., Takasugi, S., Osawa,
S., Hashiba, K., and Perales, K.: “Temperature Profiling/Bottom Pressure
Monitoring System Using Optical Fiber and Capillary Tube – Field Test in a
Geothermal Well,” 1995 Annual Meeting Geothermal Research Society, Japan.
2.
Orrell, P., and Harjes, B.:
“Borehole Temperature Measurements using Distributed Fibre Optic Sensing,”
International Institute for Geothermal Research (1993).
3.
Karakan, S., Kutlik, R., and
Kluth, E.: “Field Trial to Test Fiber Optic Sensors for Downhole Temperature
and Pressure Measurements West Coalinga Field, California, SPE 35685 (1996).
Pressure Sensing:
Multi-point fiber optic pressure
sensing can be used for permanent monitoring operations to discern reservoir
pressure and zonal contributions. Some
typical examples include evaluating fractured systems, measurement of drawdown,
assessment of skin, reservoir heterogeneity, permeability, completion
efficiency, drainage and front radius inferences, developing performance curves
…
Principles of Operation:
Pressure is measured using a
self-referencing optical technique. The
system detects small changes in distance that occur between two points in a
ceramic pressure head when the pressure is varied. The micron (10-6 m) scale gap in the sensor head is monitored using
optical interference patterns to provide accurate pressure readings. The ceramic sensor is designed
to be stable at elevated temperatures over extended time periods. Sensor temperature compensation
is achieved by using concurrent Distributed Temperature measurement. The
fiber optic pressure sensor is protected by US Patents 5446280, 5963321 and
6069686.
All of the necessary optical equipment sources and detectors are maintained at the surface away from the downhole environment. The Surface Readout Systems (SRO) is an opto-electronic assembly. It houses the light source and the photo-detectors, along with the ancillary couplers and filters. The unit has its own power supply, digital processor and data storage systems.
Laser light is transmitted to
the sensor using a cable that can contain up to 12 optical fibers. This allows up to 11 pressure sensors and a
Distributed Temperature measurement to be installed in a single well with one
cable, if required. Figure 3 shows the
accuracy of fiber optic pressure measurement.
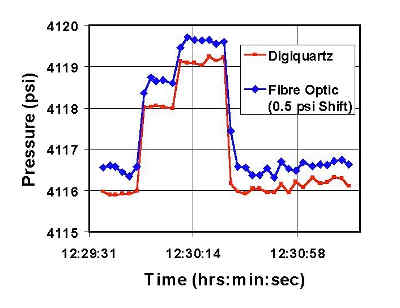
Figure 3. Comparison of pressures measured using fiber optics methods with those determined from a digital quartz gauge.
Specifications:
|
Operating Range |
0 to 18,000 psi in 2,000 to
6000 psi steps |
|
Accuracy |
+/- 0.035% of range |
|
Resolution |
+/- 0.05 psi |
|
Repeatability |
+/- 0.035% of range |
|
Long term drift |
<0.5 psi per year |
|
Sampling frequency |
1 second plus |
|
Maximum temperature |
175°C |
|
Temperature accuracy |
0.5°C |
|
Measurement range |
>12 km |
|
Housing Diameter |
0.625 inches |
Implementation:
In its
simplest form the pressure sensor can be deployed like a conventional
electronic gauge. Initial designs are suitable for installation outside 4 1 /2 "
tubing located inside 7" casing.
Several Sensa pressure sensors can be installed on the same completion
and used to monitor the pressure in different producing zones or the pressure
distribution along a horizontal section. A full range of accessories has
been developed to allow the deployment of sensors in different well designs.
These include wellhead adapters and penetrators, cables, packer penetrator kits
and downhole connectors.
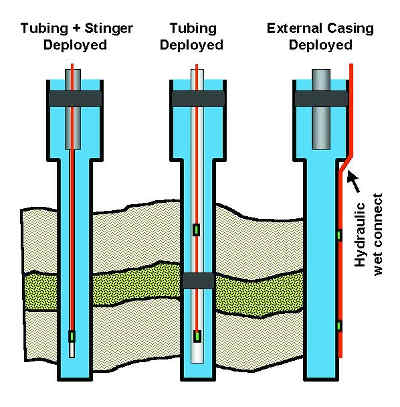
Figure 4. Pressure Gauge Deployment.
Armored cables can contain up to
18 individual optic fibers. These
cables are rated up to 10,000 psi working pressure and 150oC.
Continuous lengths up to 10 km are available in various alloys to suit the
environment.
The pressure sensor can be
deployed like a conventional electronic pressure gauge. The system can be installed outside
4.5" tubing inside 7" casing.
Several fibre optic pressure sensors can be installed on the same
completion and can be used to monitor the pressure in different injection zones
or the pressure distribution along a horizontal section.
The pressure gauge can be installed
either above or below the packer and can be configured to measure either the
tubing or annulus pressure, as required.
Two pressure gauges mounted 10 meters apart can be used to monitor
producing fluid density. Figure 5 shows
a typical installation.
If required, several gauges can
be installed in the same well using either a cable or control line
implementation.
Figure 5. Optical connectors, packer and the pressure-sensing component.
The pressure sensor has
advantages for permanent well monitoring operations. For example:
·
Downhole electronics are not required and reliability is
high. There is high accuracy,
resolution and stability for continuous monitoring and transient analysis.
·
Up to 11 pressure and distributed temperature measurements
can be configured on one multi-cable.
·
The compact OD sensor design is suitable for slimhole
operations.
·
Surface readout allows additional channels to be added at
any time
·
Standard cable design incorporates the Distributed
Temperature Sensor.
Acoustic Flow Sensor
Acoustics sensing measures flow,
determines changes in fluid phase and detects sand production (Figure 6). Optical acoustic monitoring is a
new tool for permanent monitoring. Cutting edge fibre optic technology monitors
near-field acoustic noise and vibration, providing real time data on downhole
flow and sand production.
Applications could include measuring flow rate, discerning flow
type/regime, monitoring pump condition, leak detection, and sand production
monitoring …
Figure 6. Comparison of acoustic and vibration sensor response mounted on an ESP monitor.
The
acoustic flow sensor is a permanent, fiber optic sensing system that can be
installed at several points along the producing interval to give an inflow
profile of single phase oil, water, gas and sand. Measurement of near-field acoustic noise and vibration is
achieved using fibre optic time domain reflectrometric interferometry
technology developed by Thompson Marconi Sonar Ltd. and available exclusively
from Sensa Ltd. for use in the oil and gas industry.
The
sensor consists of a wound length of fibre using patented techniques,
encapsulated in a pressure housing which is acoustically mounted at customer
defined locations on the completion (Figure 7). The chamber is acoustically coupled to the completion at a
customer-defined location within the well. This can either be externally
on tubing, measuring flow inside, or mounted on a “stinger” inside the
producing zone measuring external flow.
The sensors are interrogated with highly coherent pulses of laser light. The returned signals, containing the
acoustic data, are demodulated in the Opto-Electronics surface unit and
recorded. The data are then processed
for significant events and stored for offline processing/ trending if required.
Figure 7. Deployment schematic.
Specifications
are shown in the following table.
|
Frequency
range |
5-10,000
Hz |
|
Dynamic
range |
80
db |
|
Sensitivity |
30
mV/ms2 |
|
Frequency
resolution |
1/20
Hz |
|
Maximum
temperature |
150°C |
|
Maximum
pressure |
20,000
psi |
|
Time
increments |
15
minutes plus |
|
Operating
range |
20
km |
Features of this system include:
·
Requires no downhole
electronics ensuring high reliability
·
High temperature capability (up
to 150oC)
·
Fibre optic sensors are immune to electromagnetic
interference (EMI) and are thus unaffected by ESP motor electrical noise
·
Continuous data acquisition –
without well intervention
·
A single sensor can be used for
flow rate, flow regime and sand detection
·
An array of sensors can be
installed on a single optical fibre
·
Sensor arrays can be run
together with Sensa fibre optic pressure and distributed temperature systems
using one fibre optic multi-cable.
Deployment:
Acoustic sensors can be mounted
on an ESP pump or motor to monitor performance. They can also be installed at
any point along the production tubing to monitor flow or sand production e.g.
between producing zones. Mounting the
Sensa Acoustic Sensor on an ESP pump or motor will allow the low frequency
vibration spectrum to be monitored all the time. Increases in vibration will
indicate deterioration in the efficiency of the pump or motor and allow
appropriate decisions to be made about optimization or replacement.
Principles:
McKinley and Bower (SPE 6784)
demonstrated that acoustic signals in a borehole are proportional to the flow
rate and pressure drop along the flowing section. Thus a permanently installed
acoustic sensor can indicate flow rate changes in flow over time. Van der Spek (SPE 50640)
demonstrated that acoustic measurements could also be used to successfully identify
flow regime using neural net technology.
Sand production causes high
frequency noise due to the sand particles impinging on the pipe walls.
Conventionally, acoustic sand detectors are mounted on pipe bends at the
surface. The
Sensa Acoustic Sensor provides the opportunity to install a sensor device above
each producing zone - thus identifying which is the source of sand production.
References:
1.
Van der Spek, A (1998)
"Neural Net Identification Of Flow Regime Using Band Spectra Of Flow
Generated Sound," SPE 50640,SPE, The Hague, The Netherlands.
2.
Mckinley, R.M., Bower, F.M.
& Rumble, R.C.: "The Structure And Interpretation Of Noise From Flow
Behind Cemented Casing," SPE 6784, SPE-AIME San Antonio, Texas
(1973).
Example Field Applications
Fiber optic-distributed temperature sensors
installed using the Sensor Highway conduit can supercede coiled tubing-conveyed
production logs. Two Wytch Farm wells
(onshore/offshore development on the southern English coast) have been
completed with fiber optic sensors. The
purpose of the sensors is to monitor downhole electrical submersible pumps and
well performance. One of the wells is a
relatively simple vertical completion with an ESP, while the other is a more
complex horizontal dual-purpose well.
The distributed temperature data from the simple
ESP completion was effective in describing the operating condition of the ESP
pump.
In the horizontal well's case, there are
encouraging indications that inflow along the horizontal section is
observed. This dual-purpose
injector/producer has a crossflow sub to allow produced water reinjection below
the oil/water boundary while crude is produced along a long horizontal section.
Conventional PLTs cannot be run in this well because the ESP requires a shroud
and there is no logging bypass. In
addition, the cross-flow sub is not full bore.
The
BP-Amoco Wytch Farm site uses ERD wells to reach the reservoir located under
Poole Harbour and the English Channel.
It was desirable to monitor the complete
temperature profiles of the wells and in particular the producing zones - to
determine which areas of the reservoir are producing and to identify any
production problems, such as water breakthrough.
The
Sherwood reservoir extends approximately 15 km under Poole Harbour and the English
Channel. Some of the wells have been
drilled out horizontally with a measured depth of over 10 km and a vertical
depth of ~1600 meters. Artificial lift
is used because of low reservoir pressure - generally by downhole electrical
submersible pumps (ESPs).
Following
a successful test to evaluate both ease of installation of the Sensa system in
well K-7 in 1997, Sensa’s real-time, fiber optic distributed temperature
monitoring systems were installed in extended reach development (ERD) wells –
M-12 and M-17 in 1998 and 1999 respectively.
Producing
9,500 barrels per day, M-12 is a dual-purpose completion – where oil is
produced and water is injected into lower zones to maintain reservoir
pressure. While this type of completion
cannot be logged using conventional production logging techniques the Sensa
system proved to be relatively simple to integrate into the completion. The fibre optic control line was attached to
the outside of the 4" production tubing, with a hydraulic ‘wet connect’
supplied by Baker Oil Tools to allow disconnection of the lower completion for
ESP maintenance, if required. With a
measured depth of 5,100 meters and a vertical depth of 1,500 meters, a total of
10,500 meters of optical fibre were installed in the well to provide temperature
data points at one-meter intervals over the whole length of the well.
M-17
produces approximately 5,000 barrels a day by ESP pump and is not used for
water injection. In this case, the
fibre optic control line was installed across the reservoir attached to a 2 7/8” tubing ‘stinger’ below
the ESP.
The
relative proximity of the wellheads for both M12 and M17, meant that both wells
could be monitored using a single multiplexed processor, located at a central
location.
Following
the installation of Sensa instrumentation in M-17, temperature profiles of both
wells have been monitored with 100% reliability. For the first year following
installation in M-12, the well was monitored during shut-ins or multi-rate well
tests.
Ongoing
reporting of real-time monitoring data from M-17 provided a continuous picture
of the reservoir temperature changes with time. Recording a significant temperature drop at the toe of the well,
the Sensa system identified a zone of cold injection water breakthrough,
believed to be from a nearby seawater injector.
Analysis
of M-17 data using a thermal wellbore simulator identified the majority of
production was at the heel of the well, highlighting a possible fault. The simulator allows a variety of producing
scenarios to be examined so the most likely solution – which fits both with the
observed temperature response and other reservoir and production data – can be
determined. By matching the thermal
simulator model to the recorded temperature data, producing zones can be identified
and production estimates obtained. Instant Information.
A key
issue with M-12 was the ability of the Sensa system to quickly identify water
production from behind the casing of a cemented off water zone. Conventional
production logging techniques may have highlighted the problem if it had been
possible to log this well. However,
this information would have only been acquired after an expensive logging run
had been completed and the results interpreted. Instant access to complete thermal well profiles allows for a
more proactive approach to reservoir and production monitoring.
Data
from both wells are recorded continuously 24 hours a day and downloaded once a
week remotely by telephone line to the Sensa head office in Andover. Daily checks are made on the well profile
and BP-Amoco is notified immediately if a significant change is observed. Detailed data interpretation is carried out
by Sensa and discussed with Wytch Farm reservoir and production engineers on a
monthly basis. Sensa uses Landmark
Wellcat™ software to produce a thermal model of the well based on multi-zone
flow. Comparing the thermal response of
flowing and non-flowing zones to the measured data gives valuable information
on interval production. Data is
supplied to BP-Amoco both as DTS.bin files and summarized EXCEL™ spreadsheets.
Baker
Hughes substantially provided a completion, - an evolution from the earlier
Wytch Farm M10 well completion design – for a well with >6,000 meters md,
producing oil over about 1,000 meters.
It was desired to determine whether continuous distributed temperature
measurements along the producing interval could be used to describe the
production inflow response along the perforated section.
This was a one-trip completion using a hydraulic
wet connect system (Baker Oil Tools) to permit installation of the sensors
below the ESP. A Baker JMZX packer was
used as the linear tieback packer. The
large bore allowed running the dual 1/4-in. conduits and clamping them to the 4
1/2-in. tubing running along the producing interval and run to a turnaround sub
that was set above the lower packer - a Baker SABL-3 Hydro set design. This installed the two 1/4-in steel conduits
in the pre-perforated horizontal producing section.
The wet-connect tool was operated during the
completion phase to enable the completion space-out to be performed. Fluid pressure in the 1/4-in, conduit was
increased to allow the interlock function to be disabled and the tool was
disconnected, parting the string below the shrouded ESP. After spaceout, the tool was reconnected and
the conduit was successfully pressure tested.
A completed loop of 1/4-inch conduit, 10,000 meters
long, was installed in a complex horizontal well, including a 1,000-meter
horizontal section where the conduit was clamped to the outside of 4 1/2-in.
tubing inside a 7-in. liner. The next
step was to install 10,000 meters of optical fiber using fluid drag into the
1/4-in conduit loop!
Initially, the fiber wouldn’t deploy into the
conduit. After the conduit was flushed
with isopropanol (to remove hydraulic oil), the fiber went through without
difficulty. Initially, a 6,000-meter-length fiber was installed to operate in
single-ended mode. Later, this will be replaced by a 10,000-meter fiber loop.
Distributed
temperature data is being gathered in a well from which real-time well
performance data would otherwise have been unattainable. Early results suggest the temperature
profile along the 1,000-meter horizontal section is not linear and that there
are regions of greater or lesser temperatures.
Fiber
optics can be used to manage intelligent well operations. Through controlling the channeling of
hydraulics with fiber optic switches, it is possible to operate an array of
tools located within the wellbore from the surface. Numerous fiber optic
actuators are available that are capable of exerting large forces, with
sufficient displacements ranging from several micrometers to a few millimeters.
Piezoelectric actuators have been adopted widely.
Their main advantages are generation of large forces, high movement resolution,
high dynamics and the potential for miniaturization. It should be possible to
operate certain hydraulic devices (such as safety valves and sliding sleeves),
to optimize gas lift valves and to set packers using these systems.
Some Other
Applications
Flow Rate Measurement
Using a fiber optic distributed temperature measurement
system, changes in temperature with time can be correlated with fluid
flow. Thermal profiles can be
determined in a vertical well with a single
zone, a vertical well with multiple
zones, high rate horizontals and low rate horizontal wells.
Vertical Well
Single Injection/Production Zone
The temperature profile in a
vertical (or deviated) well depends on the virgin geothermal gradient, the
injected/produced/formation fluid, the thermal properties of the formation, the
mass flow rate and the injection time.
Characteristically the temperature profile above any producing/injecting
interval becomes asymptotic to a line that is parallel to the geothermal
gradient. This temperature profile
changes with flow rate. This is shown
schematically in Figure 8. Injection
measurements for injection may be more subtle and the most diagnostic
information may come from the nature of thermal recovery in the wellbore when
the well is shut-in.
Thermal logging has been
frequently used for modeling the vertical extent of hydraulic fractures that
have been placed for stimulation purposes.
Certain precautions are necessary.
First, if the fracture deviates from the wellbore, even by a relatively
small amount, the full vertical extent may not be evident. Often, temperature logging after hydraulic
fracturing only shows the perforated interval.
In addition, in hydraulic fracturing for stimulation dead fluid in the
rat hole sometimes masks downward growth (may or may not be an issue for an
injector).

Figure 8. This shows a single production zone in a vertical well and how the temperature profile deviates from the virgin temperature profile with an increased rate of production. It is more difficult to determine definitive inflow for injection situations because the wellbore temperature is dominated by the nominally constant injection fluid temperature. Excursions may be evident due to changes in formation temperature and the rate at which the temperature recovers if the well is shut-in (analogous to temperature logging for mapping hydraulic fracture extent).
Vertical Well Multiple
Producing Zones Thermal Profile
In a production scenario, where flow is coming from more than one zone, additional production from a higher interval will enter the wellbore at a lower temperature. The contribution from each zone can be estimated from the drop in the overall fluid temperature as the two fluid streams combine. Again, flow distribution in injectors may be less apparent from thermal variations although the same concepts apply (Figure 9).
Figure 9. This shows two production zones in a vertical well and how the temperature profile deviates from the virgin temperature profile with an increased rate of production. It is more difficult to determine definitive inflow for injection situations because the wellbore temperature is dominated by the nominally constant injection fluid temperature. Excursions may be evident due to changes in formation temperature and the rate at which the temperature recovers if the well is shut-in (analogous to temperature logging for mapping hydraulic fracture extent).
Horizontal
Wells - High Flow Rate
During production, as oil flows along a horizontal well the
pressure drop causes Joule-Thompson warming of the fluid. The reverse can be true for gas. This temperature is at least partially a
function of the flow rate. Given
sufficient flow, a temperature increase (or decrease depending on the fluid
properties) of over one degree Centigrade may be generated along the horizontal
section. This can readily be
detected. You can imagine applying
similar considerations (differential temperature along the length of the well
depending on how the flow is partitioned into various zones) for
injectors. Figure 10 is an example for
a production scenario. If the rate is
low, changes in temperature are smaller and passive thermal measurements may
not be adequate. Sensor technology has
overcome this (see low rate horizontal wells).
Figure 10. Inflow and outflow can be discerned by judicious monitoring of the temperature profile in high rate horizontal wells. Modest temperature variations can be discerned. If the rate is not high enough, it may be necessary to “help” the sensors (see low rate horizontal wells, below).
Horizontal
Wells - Low Flow Rate
In low rate horizontal wells,
the measured temperature will not vary adequately as a function of flow. To overcome this, Sensa has developed a
method of creating short thermal transients in the flowing fluid using their
patented Flo-Trak™ system. This enables
the velocity of the flowing fluid to be measured at each Flo-Trak™ element
location by tracking a slug of cooled fluid, created by the Flo-Trak™ system,
with the distributed temperature system (refer to Figure 11).
Figure 11. For low rate wells, measurement is not strictly a passive activity. Thermal transients are induced and monitored.
How
is Flow Rate Determined?
The Flo-Trak™ Fluid Velocity Tracking System uses a pre-installed Sensa Distributed Temperature System and heating coils to accurately track the velocity of single-phase fluid at low flow rates at specified points downhole.
The
Flo-Trak TM Fluid Velocity Tracking System* uses a pre-installed
Sensa Distributed Temperature System and heating coils to accurately track the
velocity of single phase fluid at low flow rates at specified points downhole.
Measurement of fluid velocity is achieved by creating a transient temperature
anomaly in the produced fluid with a heating coil and tracking this anomaly as
it moves up the well using a sensitive fibre optic
This
records the fluid temperature every meter along the fiber at sampling
frequencies down to 1 Hz. Localized
heating is achieved from the friction of high-pressure nitrogen gas being
pumped through a small diameter coil acting as a counter-flow heat
exchanger. Delivery of the gas to the
coil is through a pre-installed control line allowing the coil to be actuated
at any time from the surface.
Distributed temperature is measured by sending a pulse of laser light
down the pre-installed optical fibre.
Molecular vibration, which is directly related to temperature, creates
weak reflected signals. The reflected
signal is detected in the surface read-out unit and is converted to values of
temperature at 1-meter intervals along the fibre and well.
Some
of the system features include:
·
Simple sensor design requires no downhole electronics -ensuring high
reliability
·
Can be installed to measure low
flow rates near the toe of horizontal wells
·
Can be installed on either side
of laterals in multi-lateral completions to define lateral contribution
·
Can be installed and used with
viscous fluids
·
Will measure fluid velocity in
either direction
·
Can be actuated at any time
from the surface (with a DTS and Nitrogen unit) to monitor flow as required
The
temperature anomaly produced by the heating coil is tracked up the well using
the fibre optic Distributed Temperature System once the heating coil is switched
off. The track of the anomaly with time versus depth gives the velocity of the
fluid.
It has
been manufactured under license from British Telecommunications plc and is the
property of Sensor Highway Ltd. Sensor.
Performance of Gas Lift Mandrels
The distributed temperature system can be used to monitor the performance of the wells Gas Lift Mandrels (GLM's). The Joule Thompson cooling effect of gas blowing through the mandrel identifies its location and cools the producing fluid, giving a qualitative indication of the mandrels efficiency. A mandrel that is slugging gas, rather than operating normally, would be readily identified using time dependant thermal monitoring.
Artificial lift is used in many fields to overcome the
effective hydrostatic head on the reservoir and so allow the oil to flow to
surface. Artificial lift involves the input of energy through gas injection;
electric power to ESPs or PCP's and improvements in the efficiency of these
methods can readily improve incremental oil production. Sensa provides downhole sensors for
performance monitoring of these systems.
Sensa’s distributed temperature
system can be used to control injection pressures according to the lifting
efficiency required.
Sensa reported that fibre optic real-time monitoring would be
(if it has not already) installed to optimize inflow performance of Shell
Expro's gas lifted oil wells in the North Sea.
Background
With
the ultimate aim of improving both the management and performance of well
inflow, Shell’s initial trial set out to assess Sensa’s fibre optic distributed
temperature system for its suitability to North Sea operations. The first well
to be monitored was a gas-lifted offshore well.
“Test
results to date have substantiated the Sensa technology claims and now Shell
Expro is planning to use the system to monitor inflow across the
reservoir.”
Initial
trials were carried out on Shell Expro’s Tern well TA-27, a 10,500 ft deep gas
lift well - completed with 9 5 /8" casing and 5 1/2" inch tubing. Gas lift valves were set at
1,235, 2,190 and 2,825 meters.
Monitoring gas lift valves has to date only been achievable in wells
equipped with single point temperature probes set around the valve itself or by
conventional logging methods. The
distributed temperature system provided a complete thermal profile of the well
and identifies the correct operation of the appropriate gas lift valve by
monitoring the change in temperature of the produced fluid as it passes the gas
lift valve.
The
first stage of testing was to demonstrate the Sensa technique for pumping
optical fiber into a hydraulic conduit (control line) to just above the
packer. Serving as both a sensor and a
transmission system, the fiber provides temperature readings at one-meter
intervals from the surface to below the lowest gas lift mandrel. The temperature profiling system was able to
monitor the well during critical operations such as start-up and unloading as
well as monitoring the gas lifting system throughout its operation.
Results:
Tern
well TA-27 was successfully installed with Sensa’s distributed temperature
system and has been monitoring temperature on a continuous basis since 28 April
2000. The Sensa system can identify
critical temperatures throughout the well. Analysis and interpretation of the
continuously acquired data will allow completion design to be modified for
future wells to be completed at lower costs and greater safety. For example, the continuous acquisition of
temperature data will enable hydrate and wax formation to be proactively
inhibited and so allow subsurface safety valves (SSSV) to be located as near to
the surface as possible. This will
translate into significant cost savings brought about by the reduction in
casing sizes for the completion and possibly a simpler SSSV design.
Sensa’s
temperature measurements also highlight the proximity of other wells and can
indicate where interference from different wells is affecting production.
By
pin-pointing well inflow rates, distributed temperature measurements can
identify any early signs of scale build-up, enabling Shell Expro to put
preventative maintenance in place to preempt problems such as blocked safety
valves.
Distributed
temperature data are recorded continuously on the Tern platform, 24 hours a day
and distributed to Shell Expro and Sensa via an Internet link for storage and
interpretation. Daily checks are made
on the well profile by both companies – providing an immediate indication of
any significant change in the well’s performance. Detailed data interpretations are produced and discussed on a
monthly basis.
To
verify the quality of Sensa’s data, Shell Expro has also carried out tests and
comparisons with known geothermal temperatures – proving the reliability of the
new technique. Comparing the thermal response of flowing and non-flowing zones
to measured data provided by Sensa’s interpretation package – provided by
Landmark Wellcat™ – gives relevant information on interval production.
Shell U.K. Exploration and Production (Shell Expro)
operates in the U.K. sector of the North Sea on behalf of Shell, Esso and other
co-venturers.
Is Crossflow Occurring?
Distributed temperature monitoring allows identification of
crossflowing zones (which have a similar thermal response to flow outside the
casing) identifying which reservoir intervals have higher or lower pressures
after periods of production.
A distributed temperature system can provide real-time
information as a downhole permanent distributed temperature-monitoring
system. Figure 5 shows one typical
application for determination of crossflow.
Figure 5. Temperature monitoring along the completed length can provide indications of crossflow.
Water Production
The different thermal properties of water, compared to oil,
cause a shift towards the geothermal gradient when a zone flowing oil goes wet.
If distributed temperature is being continuously monitored there will be a
change in the thermal profile at the point of water entry which will correlate
in time with the increase in water cut observed at the surface - and thus
identify the location of the water entry.
Gas Production Monitoring:
When gas is produced, the pressure drop around the well bore
will cause Joule Thompson cooling of the gas as it enters the wellbore. This can be identified from a distributed
temperature profile.
In vertical wells multiple gas entries can be recognized from
their cooling effect and the thermal response can be analyzed to give an
indication of contribution by zone.
Figure 6 is a schematic of this behavior.
Figure 6. You can use deviations from a baseline thermal profile to determine entrance of gas in one or more zones in a producer. Changes in the relative contribution of the produced fluids will be reflected in changes in the observed temperature profile.
Monitoring Injectors:
When water is injected into a reservoir the thermal profile
observed in the well bore is normally close to that of the injected water
surface temperature. However if the
well is shut-in for a period, the permeable zones, which have been taking the
water (colder if seawater, hotter or slightly cooler if produced water), warm back
towards the geothermal gradient at a much slower rate than those that are not
permeable.
Monitoring the warmback
temperature response when the well is shut-in will identify the permeable zones
and an estimation of the relative contribution can be made.
Fracture Identification
Through continual processing of the continuously acquired
temperature readings it is possible to determine precisely where the
temperature unexpectedly changes along the wellbore. These changes can mark the
presence of fractures, faults and can confirm into which zones the injected
water is flowing. Because it continuously and accurately measures the
temperature along the wellbore in real time, the DTS system could provide
information that would enable the productivity of some wells to be increased by
10-20%.
Intra-Well Flood Rates:
Water injected into a reservoir will cool the reservoir at
the point of injection to a radius that is typically half the way to the
water/oil flood front. Thus if the producing well is close to the injector the
breakthrough of injected water will be followed, after a period, by a cold
thermal front which can be identified using the distributed temperature system.
The rate of flow between the two wells can be estimated by
shutting in the injector well for a period, allowing it to warm up, and then
re-commencing injection causing a new thermal front to move towards the
producer.
Flow Behind Casing:
Temperature monitoring responds to thermal effects generated
both in and outside the well bore. Consequently if there is an interval with
fluid flowing outside the casing, either cross flowing between zones or exiting
into the well bore this would have a characteristic response which will be
readily identifiable on the distributed temperature profile.
Steam Injection Monitoring:
Steamflood
efficiency can be continuously monitored and optimized. This has been done onshore in California,
Indonesia, Venezuela and Canada at well temperatures between 100 and nearly 300oC. A reference is Saputelli, L., Mendoza, H., Finol,
J., Rojas, L., Lopez, E., Bravo, H., and Buitrago, S.: “Monitoring Steamflood
Performance Through Fiber Optic Temperature Sensing, SPE 49184 (1998).
Monitor Wells - Regular distributed temperature monitoring in steam flood
monitor wells can identify the arrival of steam fronts by time and depth giving
an indication of the efficiency of the steam flood sweep.
Injection Wells - Distributed
temperature monitoring in steam flood injection wells can identify the
intervals taking steam and the size of the steam chamber in SAGD wells. The
combination of thermal modeling and distributed temperature monitoring during
steaming can identify the radial extent of the steam front in the reservoir and
be used to optimize steam injection.
Sand Detection
Sand
production causes high frequency noise due to the sand particles impinging on
the pipe walls. Conventional sand
detection systems use acoustic monitors to indicate the production of sand, but
are limited to surface installation and so cannot differentiate between sand
production from different producing intervals.
The acoustic flow sensor provides the opportunity to install a sand
detection sensor above each producing zone - thus identifying which is the
source of the sand production.
Multi-Phase Flow Measurement
It has been demonstrated that acoustic measurements can be used to
successfully identify flow regimes using neural net technology. Although a number of different sensors are
required to fully describe multi-phase flow, in the case of liquid/gas flow in
horizontal pipes the slug flow regime is often dominant and can be detected
using an acoustic flow sensor alone.
The acoustic flow sensor can detect slugs by their characteristic
frequency response in liquid/gas multi-phase flow – thus allowing flow regime
identification. If two sensors are
mounted adjacently the velocity of the slugs can also be measured.
Single Phase Flow Measurement
It has
been demonstrated that acoustic signals in a borehole are proportional to the
flow rate and the pressure drop along the flowing section. Thus, a permanently installed acoustic flow
sensor can indicate flow rate and changes in flow over time. Because of its robust construction, with no
moving parts or electronics, the acoustic flow sensor can be installed
between producing zones to give zonal contribution rates similar to that achievable with conventional spinner
production analysis.
SMART Well Control
Background:
BHP Petroleum’s Douglas field is
located in block 110/13 in the Liverpool Bay Development off England’s North
West coast. It is a low-pressure
reservoir using ESP artificial lift to produce oil from several zones.
During the life of the field it
is expected that there will be water ingress into the wells from one of the
zones. BHP identified that a new well
installation would address water shutoff by using a remotely actuated hydraulic
sliding sleeve system (smart well).
It was determined that Sensa’s
DTS (distributed temperature system) could identify the temperature effect due
to water ingress and indicate the water producing zone, indicating which sleeve
would need to be closed.
System Design:
A completion comprising ESP,
hydraulic on/off disconnect, retrievable packers with hydraulic feed-throughs
and hydraulic Interval Control Valves (ICVs) was installed on the Douglas
Platform during December 2000.
Sensa installed their distributed
temperature sensor fibre into one of the control lines that was used to actuate
the ICVs. This control line was Sensa’s
specialist SBF control line specifically used for fibre deployment. The system was designed so that an optical
fibre could be used for monitoring each of the three ICVs to indicate which of
the producing zones showed a temperature change - water breakthrough. BHP could then isolate that zone.
As the Halliburton (PES)
mini-hydraulic system was initially designed purely to operate hydraulic
sleeves. It was modified to ensure that
fibers could be deployed successfully for the duration of the well’s life. This required a new design of on-off wet-connect
and a hydraulic isolation tool (HIT) to facilitate fibre installation.
BHP installed the
Sensa/Halliburton intelligent ICV system in December 2000. Once the completion was nippled up and fully
tested, the optical fibre was deployed into one of the control lines. 5,100 ft of fibre were installed, tested and
connected to the surface equipment.
Sensa’s surface equipment was
already installed on the platform having been monitoring the distributed
temperature in another well for 20 months.
This included a remote access facility for data extraction,
configuration etc. All that was
required to activate the distributed temperature system was to link the new
well’s downhole fiber to the existing surface DTS computer.
Temperature traces
are transmitted directly to BHPs and Sensa’s offices for interpretation. During the later part of December 2000,
there was a noticeable drop in the temperature (approximately 5°C) of the
production fluids observed in the optical fibre at the upper completion
zone. Analysis of other surface
parameters revealed that, coincident with this temperature change, the platform
had observed a dramatic increase in water cut from below 20% to over 35%
(mainly injected water). With this type
of measurement across the entire production interval and the ability of the ICV
system to isolate specific zones, production of water can be located and
minimized.
Other Assorted
References:
Frankenburg, A., Bartel, P.,
Roberts, G., and Hupp, D.: “An Optical Probe Tool For Measuring Gas Holdup Is
Referred To In Gas Shutoff Evaluation And Implementation, North Slope, Alaska,”
SPE 62892, 2000 SPE Annual
Technical Conference and Exhibition, Dallas, Texas 1–4 (October 2000).
Recent advances in production
logging technologies, including a new optical probe tool for measuring gas
holdup, have provided the ability
to directly measure gas holdup (Yg) in horizontal well bores. This measurement has greatly enhanced our
ability to quantify oil and gas contributions from producing intervals. Evaluation of the production profiles was at
minimum a two-phase problem (oil and gas) and usually three phases were
involved. Production logging tools were chosen to allow evaluation of
three-phase downhole fluid conditions in the horizontal wellbores on a
perforation set-by-perforation set
“Enhanced recovery techniques
used in Prudhoe Bay include produced water and gas re-injection to maintain
reservoir pressure as well as miscible injectant to increase displacement
efficiency. Both of the gas injection
techniques, along with natural pressure depletion, have created free-gas entry
points within existing well completions.”
“The tool string selected was
chosen not only because it could identify fluid entry points, but also because
it could accurately identify three-phase fluid contributions for each interval
logged. The tool string included gamma
ray, temperature, pressure, X-Y caliper, spinner, water hold-up, and the new
optical probe tool for the identification of gas holdup and its distribution
across the casing at downhole conditions.
The total tool length was 20.6
feet. Each part of the tool string was
included for a specific measurement.
The gamma ray (GR) and casing collar locator (CCL) tools were used for
depth control with the GR tool also being used to identify possible radioactive
scale. The spinner tool was used to
measure fluid velocities by using multiple passes at varying tool speeds,
similar to traditional spinner evaluation.”
Horizontal wells typically
exhibit stratified flow with holdups that are deviation dependent, which
complicated the evaluation of velocity of the different phases. The small casing size and high velocities
reduced the uncertainty created by stratified flow. The temperature survey provided information for PVT calculations,
including conversion of downhole rates to surface rates, and helped identify
fluid entry points. Typical temperature
gradient analysis had to be modified for the horizontal wells, as there is
little to no vertical depth variation in this environment. The pressure survey was also used for PVT
and downhole-to-surface rate calculations.
The centralizer located at the spinner probe provided an independent X-Y
caliper measurement. This hole size
measurement allowed accurate flow rate calculations in the presence of enlarged
or reduced casing ID.
The water holdup tool allowed
measurement of water holdup where the fluid velocity did not exceed the
limitations of the tool. When the
downhole fluid velocity exceeds 350 ft/min, the water holdup measurement is not
able to distinguish hydrocarbons from water.
In this environment, the optical probe tool provided additional
information through direct measurement of gas holdup. The new optical probe tool was used to identify gas holdup for
this project.
The tool consists of four
optical probes spaced on centralizers, providing gas holdup (Yg) and
its distribution across the casing. The
optical probe tool also measures the gas bubble count rate, caliper, and sensor
orientation through a relative-bearing measurement. An image of the gas holdup distribution can be generated, aiding
the interpretation of this sensor data.
A light source is connected to a fiber optic cable, which attached to
the optical probe. The amount of light
reflected from the tip of the optical probe is indicative of the phase of the
fluid on the probe. A patented "Y
coupler" allows the measurement of the reflected light at a photodiode
located in the tool. Gas holdup is
obtained by calculating the percentage of time the probe returns a gas signal
relative to a predetermined time interval.
A gas bubble count (Bc) rate is calculated by summing the
number of gas bubbles impinging on the tip of the probe in the same time
interval. In addition, evaluating the
optical probe tool response enabled us to identify oil holdup due to the
optical properties of the liquid hydrocarbon.
While most of the wells had very low water cuts, the ability to
distinguish three-phase holdups was valuable to this project.
The horizontal nature of the
wells in this project necessitated pushing the tools to the bottom of the
wells. Two options were considered for
this: coiled tubing and tractor. Both
options allowed surface readout to monitor tool operations providing excellent
opportunities to quality control the logs, ensuring acquisition of the
necessary data to evaluate these wells.
The tractor allowed acquisition of data while logging both down and
up. The down passes were restricted to
a single tool speed, but the up passes were made at multiple tool speeds. Coiled tubing-conveyed operations allowed
logging in both the up and down directions at multiple speeds. Friction caused by flow in the casing/coiled
tubing annulus typically reduced the well flow rate but did not affect the
ability to identify gas and liquid entry into the wellbore.
A well test prior to performing
the production log evaluation indicated 1421 BOPD, 16 BWPD, and 27.6 MMscf/D
gas. The tool string consisted of gamma ray, CCL, temperature, pressure, X-Y
caliper, spinner, water holdup, and optical probe. The presence of the coiled
tubing inside the small liner caused the production rate to decrease during the
logging operations because of the increased friction created by the small
annular area. In spite of the reduced production rate, gas and fluid entry
points were clearly identified from the production logging data (See Fig. 4).
The spinner indicates high fluid velocities across the entire logged interval
with a slight increase at the middle-perforated zone and larger increase at the
top zone. The optical probe tool indicates near 100% gas holdup from the bottom
zone with liquid entry
Tague, J.R., Hollman, G.F.: “Downhole Video: A Cost/Benefit Analysis,” SPE 62522, 2000 SPE/AAPG Western Regional Meeting, Long Beach, California (19–23 June 2000).
Abstract:
“In the past few years, downhole
video has emerged as a viable and cost-effective means for analyzing various
wellbore problems. Despite this,
numerous misconceptions concerning the cost, application, and complexity
remain. In an effort to provide insight
into the proper application and selection of this unique tool, the results of
over 30 downhole video logs conducted by Chevron in the West Coalinga field
will be presented and discussed.
Examples will include images obtained of damaged liners, casing holes,
and corrosion problems, as well as their application to remedial well
work. Other examples will include
images of the in-situ producing environment, in particular, the ability of
downhole video to image fluid entry and the impact of various wellbore plugging
agents including scale and organic precipitation. Finally, the total cost of running a video log and the steps
necessary to prepare a well will be compared to more traditional means of logging. Overall, this paper should provide valuable
insight for anyone considering the use of downhole video.”
In many cases, downhole video
technology has become the logging method of choice due to its unparalleled
ability to accurately assess the downhole environment. However, downhole video technology is not
applicable in all cases.
The first attempts to use camera
technology in a wellbore occurred in the 1940’s at the request of a local pump
manufacturer located in the San Joaquin Valley. The early attempts led to the capture of black and white pictures
on stereoscopic slides that were used with a viewfinder to create a 3-D
aspect. These early cameras were very
large in diameter and limited to depths of up to 1000 feet. Technology led to further developments in
downhole video deployment in the 1960’s through development of coaxial cable
capable of handling the transmission of high frequency signals required for
motion video. In the early 1990’s, an
Electro-Opto logging cable was developed utilizing fiber optic technology. This greatly enhanced the ability of the
camera by addressing pressure constraints and opening up new applications in
production logging. The downhole video
camera uses Electro-Opto fiber optic technology. This technology produces real time video at 30 frames per second
with a working temperature of 257 F to 350 F, depending on tool diameter. The tool is made up of three basic
components – the electrical chassis, the centralizer, and the “Backlight”
camera. The light source is positioned
above the camera in the same housing.
This facilitates indirect illumination, as well as creates an
unobstructed view of the wellbore. This
coupled with a surfactant applied to the camera lens allows the operator to
descend into the well through an oil/gas column of several thousand feet and
maintain the ability to image the wellbore where a clear fluid is the primary
medium. This technology is routinely
applied to pumping wells with minimal preparation. In many cases, by shutting in the well and allowing the fluids to
separate, clear real time video can be achieved. Today, downhole video technology is a viable diagnostic tool for
many downhole applications. Downhole video technology has been used for
numerous applications including mechanical inspection, open hole logging,
formation damage analysis, fishing operations, as well as detection of fluid
and sand entry.
Limitations include well
preparation, cost, and the inability to piggyback the system with other logging
tools. The largest limitation or
obstacle to successful imaging is the effort required to prepare the well. In many cases, the wellbore fluids are too
opaque to obtain a clear image. If the
produced fluids are too opaque to provide a clear image, then additional effort
is required to obtain a clear image.
There are also costs of running the tool.
A final disadvantage of the tool
is its limitation to the field of vision and the inability to piggyback other
logging tools with the system. Thus any
attempts to gain data beyond the wellbore required multiple logging runs. However, several companies are working on
combining the downhole video camera with a suite of production logs including
spinners, tracer tools and even gamma and neutron tools. When introduced on a regular basis, this
will make the downhole video/combo tool the preferred method of production
logging. The problem is a common field occurrence and other symptoms exist, it
is often less expensive to run a simple mechanical profile log, or even an
electro-magnetic casing inspection tool.
However, if the nature of the damage is uncertain, running a video log
often proves invaluable. Fishing
Operations. In fishing operations, if the initial attempt to remove the lost
tool or item fails, running a camera
McKay, G., Bixenman, P.W., Watson, G.: “Advanced Sand Control Completion With Permanent Monitoring,” SPE 62954, 2000 SPE Annual Technical Conference and Exhibition, Dallas, Texas (1–4 October 2000).
Abstract:
“Permanent downhole monitoring
can provide valuable information for production decisions without the need to
perform an intervention to gather data.
This type of technology has been excluded from sand control completions
because of the complexity of placing measuring devices in the production
interval. This paper describes the
completion design of an openhole, horizontal, gravel-packed completion with
permanent monitoring equipment in the production interval. As is typical for gravel-packed wells, the
completion is run in two trips: the sandface completion is run in the first
trip, and the upper completion is run in the second trip. The sandface completion includes two
hydraulic lines in a U-tube configuration with a hydraulic wet connector at the
top of the completion string. The
completion is gravel packed using an alternate path technology that decreases
the risk of a failed gravel pack placement due to hole collapse or losses. It also allows placement at lower flow
rates, thus reducing the risk of damaging the hydraulic control lines. The upper completion is run and stabbed into
the hydraulic wet connect. The
hydraulic lines provide a continuous, environmentally protected conduit for the
fiber-optic line. Once the upper
completion is run and the wet connect is tested, the hydraulic lines are
flushed and the fiber-optic (distributed temperature sensor) is installed.
Openhole gravel-packed
completions have a high cost of intervention to evaluate the well
performance. In many cases the cost can
be prohibitive and may deter an operator from gathering well performance data
needed to manage the reservoir. The
challenge of incorporating permanent reservoir surveillance sensors has
historically been avoided in unconsolidated formations requiring sand
control. Complexities such as sensor
position, conductive isolation, packer interface, deployment protection, and
data interpretation have generally resulted in the use of nonintelligent
sandface completions combined with the use of conventional logging techniques
to gather data.
The use of fiber-optic
distributed temperature sensor (DTS) is one such technology (currently used in
platform and land wells only) that can help provide important real-time data
for the life of the well. Once
installed, the fiber-optic strand used in conjunction with the appropriate
software and light source becomes a highly precise temperature sensor,
providing the capability to measure subtle changes in thermal profile at
increments of +/-1.0 m, for distances of up to 12 km. Thermal profiling along the reservoir section and over the well
itself reveals trends, which when analyzed help corroborate reservoir inflow
and well performance characteristics.
Trend analysis can be used to help identify and in some cases manage the
following downhole conditions:
·
Flow contribution across zones and long horizontal
sections
·
Deduction of mass flow rate
·
• Identification of water and gas breakthrough zones
·
Optimization of flow rate to mitigate the above • damaged
or noncontributing intervals
·
Variances in permeability.
In addition to
monitoring at the sandface, having a continuous sensor along the entire length
of the well enables additional thermal data acquisition, which can establish:
·
Gas lift valve operation
·
Electrical submersible pump (ESP) performance
·
Identification of hydrate formation.
Installation of the DTS fiber is
the last phase of the completion operation.
Because the fiber is pumped through a dedicated 0.25-in. conduit, all of
the fiber connections are made at the surface.
This means that in the event of fiber degradation over time, it is
possible to retrieve and replace a sensor without affecting well operations or
necessitating intervention.
The fiber-optic sensor is
installed in a conduit line that forms a U-tube configuration with a
turn-around sub located below the bottom joint of screen. The conduit is made from 1/4-in. hydraulic
control line running from the surface.
A wet connector is provided above the production packer to join the
control line on the upper completion assembly to the control line on the
sandface completion assembly. The
control lines penetrate the production packer with a pressure-tight seal on the
bottom and top subs of the packer. The
control line is routed in a protective channel on the screen shroud to the
turn-around sub.
Openhole Gravel-Pack Screen
Assembly Alternate path technology was chosen for the openhole gravel pack to
allow lower pump rates while ensuring a complete gravel pack. High pump rates increase the risk of
damaging the control lines during the pumping operation. The openhole gravel-pack screen assembly is
a shrouded 4 1/2-in. base pipe with wire-wrap screen and an eccentric shunt
tube configuration. A timed thread is
used on the screen joints to ensure the shunt tubes line up when the joints are
made up to the specified torque. The
shunt tubes are designed to guarantee gravel pack placement on long highly
deviated intervals. The configuration
has two large carrier tubes that run the length of the screen assembly in
combination with two packing tubes that are contained within each joint. The slurry flows from the carrier tubes into
the packing tubes at the top of each joint.
The screens have a longitudinally welded shroud with a channel located
at the weld seam. The channel is sized
to contain the two encapsulated control lines used for the distributed temperature
sensor. The design ensures that the
control lines are not damaged when the screens are run into the openhole
section.
The multiport packer is a
hydraulically set 9 5/8-in. x 5 1/2-in. retrievable production packer with two
bypass ports for the 1/4-in. control lines.
The packer is set with the gravel pack service tool. The packer has dual setting pistons to
ensure a correct set in the event that tubing movement is impossible with the
long screen assembly in the horizontal openhole. The bypass ports in the packer provide a straight, uniform hole
so the control lines can be easily fed through the packer. Each control line has a metal-to-metal seal
in the upper and lower subs of the packer.
The packer has a control line test feature that allows the control line
ports to be isolated from the tubing and tested at the well site for pressure
integrity of the metal-to-metal seals.
Once the test is completed, the test port is removed and a plug is
installed. With the test ports removed,
the control line passages are once again in communication with the tubing to
ensure they remain at hydrostatic pressure, thus minimizing the pressure
differential across the control line seals.
When the packer is retrieved, the overall length remains the same to
ensure there is no damage to the control lines during the retrieval
process. Damage to the control lines
could result in a loose line that could form a “bird nest” and complicate the
retrieval process.
A hydraulic wet connector allows
a high-integrity connection for the control lines to ensure that the fiber
optic can be successfully pumped through the connection. The wet connector has a large “mule shoe” to
accept the male connector run with the production seals. The mule shoe has adequate strength to turn
and align the male connector at the bottom of approximately 8,200 ft of 5
1/2-in. production tubing. Calculations
were made to determine the amount of torsional resistance that would be
generated by the production tubing if the connectors lined up 180° out of
phase. The calculation shows that the
torque needed to rotate the connection 180° was below the breakout torque for
the tubing joints. Because make-up
torque is below the rating of the connector, it was decided not to run a swivel
above the connector. The wet connector
also doubles as the production seal bore and production seal assembly,
providing for 6-in. seals with a through diameter equivalent to 5 1/2-in.
tubing. The connector has a course and
a fine alignment system. The course
alignment is provided by a slot at the end of the mule shoe and a mating key in
the male connector. A short distance
before the control line connectors start mating, a robust key and slot
arrangement engages in the connector.
The keys and slots have a close tolerance to the position of the control
line connectors to ensure that the connections engage properly. The keys also protect the male control line
connections for tubing sizes down to 3 1/2-in.
The male control line connectors are positioned on the lower half of the
wet connector to provide resistance to debris. A female connector in this
location would tend to collect debris.
Debris in the flow line connection could prevent installation of the
fiber optic. The control line
connectors provide a clean, straight flow path to facilitate installation of
the fiber optic. No movement of the wet
connect is allowable once the installation is complete, or the fiber optic
could become damaged. Set-down weight
of the upper completion is calculated to prevent a disconnect.
Buchwalter, J.L., Calvert, R.E., McKay, C.S., Thompson, S.J.: “Maximizing Profitability in Reservoirs Using New Technologies For Continuous Downhole Pressure Systems,” 2000 SPE Annual Technical Conference and Exhibition, Dallas, Texas (1–4 October 2000).
Abstract
“Continuous downhole data in
conjunction with new reservoir analysis tools made to work with this data have
the potential to revolutionize the accuracy of reservoir management. The economic value of continuous downhole
pressure data and the array of available options justify the use of these
systems in almost all petroleum reservoir developments. The greatest value of these gauges is that
with new data analysis tools reservoirs can be accurately managed early in the
producing life, thus optimizing both short and long term reservoir management
strategies. Traditionally, the value of
these systems has been for completion optimization using a small subset of
downhole data. The full value of the
complete data stream has been ignored due to the large volumes of data, and the
lack of software systems for efficiently working with these data. Consequently the reservoir has not been
fully understood. A system of software
tools has been developed to capture the full value of the data from permanent
downhole gauges. This new software
system automates the filtering of these data in an intelligent fashion. The resulting filtered pressure data can
then input into a variety of reservoir analysis tools, for example reservoir
simulation programs can now have a continuous reservoir simulation. Reservoir and production engineers can
always have the optimal production strategy for the reservoir based on the
current data. These tools are very easy
to use, so models can be developed quickly and continually maintained with
minimal effort. Typically it takes less
than a week to build the initial model, and only a few hours a month to update
and maintain an accurate history match.
The paper will include a brief review of the downhole technologies and
the software system, which makes the data accessible to reservoir simulation
and other reservoir analysis tools.
Applications for the filtered data in both Gulf of Mexico and North Sea
reservoirs will be introduced.
Carnahan, B.D., Clayton, R.W., Koehler, K.D., Harkins, G.O. and Williams, G.R.: “Fiber Optic Temperature Monitoring Technology,” SPE 54599, paper presented at 1999 SPE Western Regional Meeting, Anchorage, AK (May 26-28).
Abstract
Fiber optic distributed
temperature monitoring of downhole conditions is an emerging technology that
can be used to obtain important reservoir temperature information where
conventional methods have failed. Due
to the development of fiber coatings and improved deployment techniques, fibers
are now used reliably up to 480°F in Aera Energy’s California field. Case 1 is an installation on tubing in rod
pump wells has been useful in detecting early steam breakthrough and is
expected to reduce the need for temperature observation (TO) wells in the
future. Case 2 is a permanent installation
on the outside of casing in TO wells, which is used to determine accurate
reservoir temperature profiles. In one
example, the fiber has shown fluid migration behind pipe, which was remediated
successfully before the steam reached the surface. Case 3 is a failed attempt to use fiber to continuously monitor
multilateral horizontal well temperatures to determine relative fluid
contributions of the wellbores without shutting in the well.