Average Reservoir Pressure
Why is this Important?
Almost any diagnostic that is carried out requires a knowledge of the average pressure in the affected region of the reservoir. Unrecognized changes in reservoir pressure can seriously impact any evaluations that are carried out on historical data.
How is the Average Reservoir Pressure Determined?
This topic is beyond the scope of these Best Practices and will only be treated peripherally. You should seek assistance from a specialist within your organization. In fact, in complicated scenarios, simulation may be a necessary compliment to measurements. Regardless, the basics are as follows.
-
Assume a well in a system with a constant pressure outer boundary, as could occur in a full voidage replacement situation. Make the standard assumptions - the reservoir is homogeneous, constant thickness - and assume that it contains a single fluid of small and constant compressibility.
-
Assume that you have been injecting at a constant rate into a fully penetrating well and that you then shut it in. The pressure is assumed to constant at a distance re from the wellbore, due to the interaction of the injector and surrounding producers.
-
Notice the difference between all producers and an injector-producer combination. For producers, there is a boundary between the wells where no flow takes place. For an injector and a producer, there is a boundary condition midway between the two where there is a contour of constant pressure. Since the pressure distribution is different between these two cases, you need to calculate the average reservoir pressure differently than you would for producers alone.
-
In a unit mobility five spot situation, the pressure at the drainage radius can be taken as the average pressure.
-
In conventional production situations, you could determine the average pressure, without much error by doing a Horner plot and extrapolating. This can result in significant errors when you analyse falloff data from an injector. This extrpolated value, a false pressure, p*, can be considerably different from the average reservoir pressure. It is necessary to calcuate the average pressure from relationships between the false pressure and the average reservoir pressure.
-
Hornerís method does not apply to closed or multi-well systems without correction. In closed, single-well reservoirs, the average pressure generally is above the extrapolated false pressure, p* (considering injectors). There are situations where the opposite can be true. It is generally most appropriate to use the Matthews-Brons-Hazebroek Method. Other methods are available and may have specific application. Consider the following example (it is taken directly from Matthews and Russell, 1967):
-
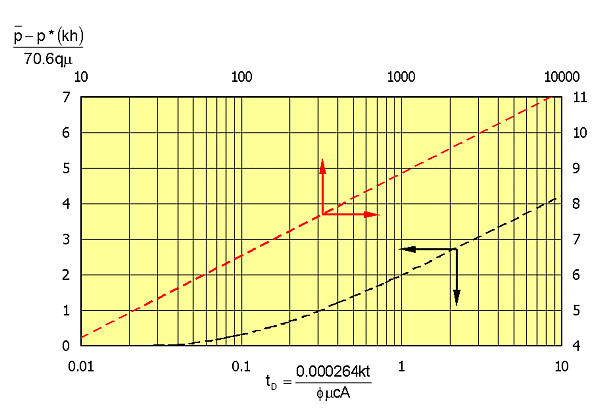
The foregoing equation incorporates the dimensionless time and there are solutions for the elliptical integral term that includes this non-dimensionalized time term. For a quick idea of what this will be, refer to Figure 2. For this example, using Figure 2 and a dimensionless time of 316, gives a value for the pressure term of 7.7.

Figure 2. Function for computing average pressure in an injection operation.
-
From Horner plot concepts (as used above to determine the permeability), once the correct semilog straight line has been determined, the permeability can be expressed as:

-
This means that:

-
Recalling that:

-
This means that:

-
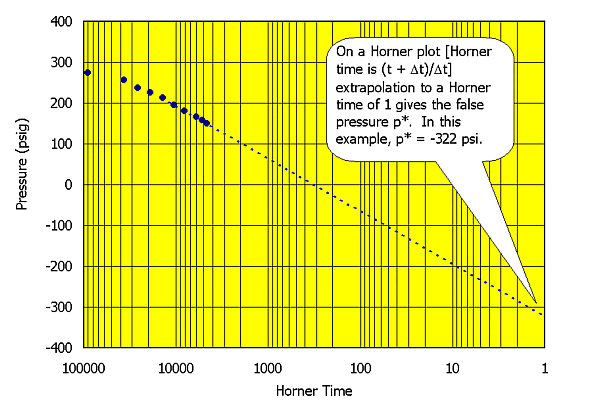
Now you need to go back to the original Horner plot and determine the false pressure, p*. This is done by extrapolating to a Horner time of 1 (Figure 3). The value determined for p* is -322 psig (a false surface pressure).

Figure 3. Extrapolation on a Horner plot gives a false pressure.
-
This means that the average pressure is:

Summary
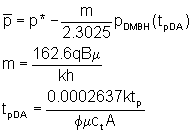
Using non-dimensionalized pressure and time, the average pressure is estimated as:

where:
m is the Horner slope
p* is the false pressure (psi)
tpDA is the dimensionless injection time
pDMBH is the MBH dimensionless pressure at tpDA (tabulated values - Figure 2)
tp is the injection time, possibly expressed as (24Wi/q if rates are variable).
Precautions
-
Remember that this applies only to unit mobility situations.
-
The shape of the injection area and the configuration of surrounding injectors and producers can make predictions difficult.
-
Regardless, be careful of extrapolating on Horner plots to determine the average pressure. This extrapolated pressure can be significantly different than the average pressure. Figure 4 shows this for the example problem that was given above.

Figure 4. Average reservoir pressure and false pressure.

![]()
![]()
![]()

![]()
![]()
![]()
![]()

![]()

