Tiltmeter Measurements
Contact Information:
You can contact Chris Wright (Pinnacle Technologies) for information on tiltmeter technology and pricing.
Introduction:
A created hydraulic fracture results in a characteristic deformation pattern in the rock around the fracture. If you measure the hydraulic fracture-induced tilt (deformation) of the earth at several locations with an array of tiltmeters, this induced tilt reflects the geometry and orientation of the created hydraulic fracture. This is shown schematically in Figure 1.
|
|
Figure 1. How a fracture at depth causes the surface of the earth to tilt slightly. Tilt-mapping, with surface installations of tiltmeters, is performed "regularly today to 10,000 feet." If surface tilt mapping is done, you usually cannot reliably get fracture dimensions reliably. At a minimum some sort of supplementary numerical modelling may be required. |
A Surface Tiltmeter Array can be used to:
|
| Figure 2. Tilt at the surface depends on the fracture that was created. |
|
| Figure 3. Tilt is measured with high-precision devices, not unlike the bubble in a carpenter's level. When the sensor tilts, the resistance between the electrodes changes. |
A Downhole Tiltmeter Array can be used to:
Surface Tiltmeter Arrays
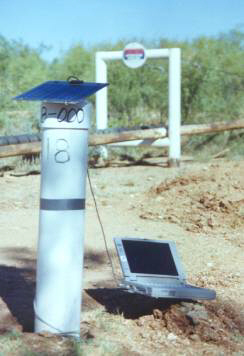
The tiltmeters (Figure 4) are installed at depths of between 5 and 80 ft below the surface in 3-inch diameter PVC pipe. Deeper boreholes can be used to eliminate "noise" from the surface - including cultural noise, thermallyh-induced earth surface motion ... A surface array can consist of, for example, 12 to 20 tiltmeters placed in concentric circles around the anticipated fracture trend (distance from well: 15-75% of the fracture's depth).
|
|
Figure 4. A schematic and a photograph of a surface tiltmeter installation. |
Tiltmeter are installed several days before a fracture treatment to allow for "settling." The tiltmeter data are stored in a datalogger that is contained within the tiltmeter itself. The sampling interval is usually approximately every ten seconds. Baseline data are collected before the fracture and continuous data are collected after the fracture treatment (manually or by radio).
After the data are collected, the signals are processed to characterize the created fracture(s) (Figure 5).
|
|
| Figure 5. The figure on the left shows characteristic tilt vectors for a vertical fracture. The figure on the right represents a horizontal fracture. | |
Downhole tilt mapping has been commercially done for about two years. For downhole tilt mapping, the problem that you usually encounter is the offset distance (distance from the event to the tiltmeters). The distance dramatically influences the reliability of the measurement and the predicted length of a fracture. For downhole deployment/measurement of tilt-mapping equipment, the existing tools are 2 7/8-inch. A smaller tool (1-inch) is being built, in partnership with Halliburton. The downhole tools are run in on wireline with standard oilfield centralizers. There is a large signal-to-noise ratio due to the short distance to the fracture. A typical scenario might be an array of six to fifteen tiltmeters placed in offset wells. The depth of the instruments is centered around the interval to be fractured in the treatment well. Figure 6 is an example.
|
| Figure 6. A schematic of a downhole tiltmeter installation. |
For downhole tiltmeters, the resolution is 5 to 10% of the distance to the offset well.
"Have they been run in a horizontal well?" The answer is no. Existing tools only have an 8 to 10� tolerance. A new generation tool is anticipated to be able to handle inclinations of plus or minus 30 degrees. This is one of the current limitations.
Although there are limitations, downhole tilt measurement does offer some advantages. For example, the amplitude of tilts measured downhole are typically 100-10,000 x greater than surface tilt amplitude. These downhole amplitudes are typically on the order of 1- 100 microradians. Figure 7 shows raw tilt data recorded downhole. The height, width and length of the created fracture(s) are estimated by inverting the tilts (Figures 8 through 10).

|
| Figure 7. Raw, downhole tilt data recorded during a hydraulic fracturing treatment. |
|
| Figure 8. Width and vertical extent are inferred from the measured tilts along the length of the observation well. |
|
| Figure 9. Fracture length can also be inferred. |
|
| Figure 10. Fracture dimensions can be inferred. |
Example Applications
Tilt-mapping has been used to monitor batch injection (cuttings) operations. Figure 12 shows an example, demonstrating quite dramatically the potential for initiating multiple fractures - a different fracture for each batch cuttings injection.
|
| Figure 11. Multiple fractures created during batch injection of cuttings. This figure in itself, lends strong credance to the disposal domain concept. |
It has been used in some produced water reinjection applications. Figure 12 shows an example, showing the chronolgical upward growth of the fracture with injection volume.
|
| Figure 12. Tiltmeter monitoring during a PWRI operation, above fracturing pressure. Progressive height evolution can be seen. |
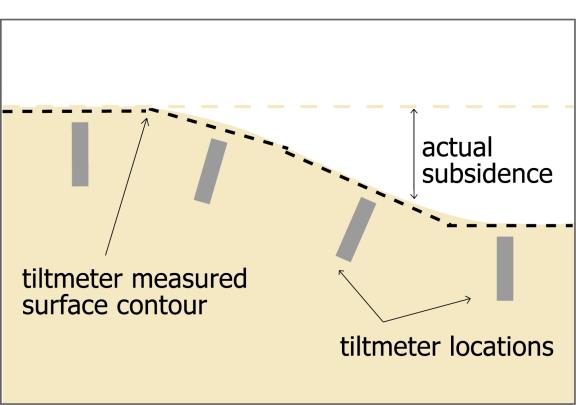
As Figures 13 and 14 show, tiltmeter mapping is a sensitive and apparently accurate method for measurement of subsidence - at least onshore.
|
| Figure 13. This schematic shows tiltmeter deployment designed to detect subsidence-related surface changes.. |
|
| Figure 14. This is tiltmeter data from an actual situation where subsidence was measured. |
Tiltmeter monitoring has shown different fracture growth patterns depending on the rate at which you are injecting. It has been reported that for low rate injection, there is strong evidence of composite shear effects in some situations. This means that shear fracturing was probably occurring and the trends of the measured features did not align with the maximum principal stress direction. Mobilization of these shear zones was impacted by the amount of leakoff, activating certain shear zones at low rates. At higher rates, the mapping showed a more discrete feature aligned with the principal stress direction. Refer to Figures 15 through 17. V.I.P.S. has shown similar rate sensitivity effects in 80 fields.
|
| Figure 15. Clean, diagnostic signals for a single hydraulic fracture in a tight gas sand reservoir. |
|
| Figure 16. If measurements are made at different times and for different injection rates into the same zone, strong trends indicate that at low rates, the directionality of the fractures created may be different than at high rates. Fluid penetration into natural discontinuites, etc. can lead to conjugate shear fractures at low injection rates. |
|
| Figure 17. This is a "blowup" of one of the monitored wells shown in Figure 17. If measurements are made at different times and for different injection rates into the same zone, strong trends indicate that at low rates, the directionality of the fractures created may be different than at high rates. Fluid penetration into natural discontinuites, etc. can lead to conjugate shear fractures at low injection rates. |
Fracture containment (or lack of), measured with tiltmeters and microseismic monitoring, is not always predicted by available fracturing models. In an injection program in the Atoka shale, fractures measured were longer than they were high and it was difficult to rationalize why there was not more vertical growth. A hypothesis made was that there was interface delamination and that this controlled of vertical growth. In other cases, thermal effects could cause containment, but this example was for a shale.
In-Well, Downhole Measurements
Pinnacle Technologies performs treatment well tilt monitoring. This is where the tiltmeters are in the injection well itself and not in an offset. There remains considerable debate on the influence of noise, although Pinnacle contends that the tilt signal is so high that it can be readily discriminated. Some people have wondered "Why do you see a tilt for the situation where the tiltmeter is in the injection well?" It requires a very slight offset for tilt to be measured, but Pinnacle has indicated that they have found this to be the case.
One concern relates to "What are the restrictions in predicting dimensions in the same well?" There may be difficulties in this associated with resolution. THIS COULD BE THE KEY CURRENT RESTRICTION. IN A HORIZONTAL WELL, IF THE FRAC GOES ALONG THE WELL YOU CAN MEASURE TILT. HOW DO YOU MEASURE HEIGHT IF THE FRAC IS TRANSVERSE TO THE WELL?
General
The typical cost of a job is $20,000 for deployment in offset wells and a couple of days of measurement (minimum!!). Typically, more wells are used and with detailed interpretation, the price is closer to $50,000 or $100,000 U.S (minimum!!). The biggest limitation has been if there is a suitable offset.
"What are the possible methodologies for modifying this technology for use in an horizontal environment? Laurence Murray, BP, has suggested that possible methods could include fiber optics and diffraction technologies. Companies offering fiber optics include Sensa (http://www.sensorhighway.com/) and Flight Refueling. There is also Pruett Industries (http://www.pruettind.com/fiber.html). With fiber optics, methods for handling perforations are an important issue.
Additional Information
For additional information, abstracted publications are also available.< Summary References >
|
|
|
|
|