An Introduction to PWRI Fracturing Models
Hydraulic fracturing simulators for stimulation have evolved substantially. Recently, some effort has been devoted to modeling fracturing processes that occur during flooding and disposal. For example, in maturing, water-drive oil fields, progressively increasing volumes of oily water are produced and must be disposed of. Reinjection is one disposal protocol that can be cost effective and environmentally attractive. Declining well injectivity, often due to particles in the injected water, is one of the major factors in increasing costs of reinjection operations. In order to maintain injectivity, it is commonly necessary to inject above fracturing pressure. Economic forecasting is contingent on the fracture geometries that are created. There are some key differences between hydraulic fracturing for stimulation and hydraulic fracturing as a means for and a consequence of injecting produced water, as are currently available in the public domain. Also, the public domain methodologies for assessing fracture geometry and pressure during produced water injection will be summarized.
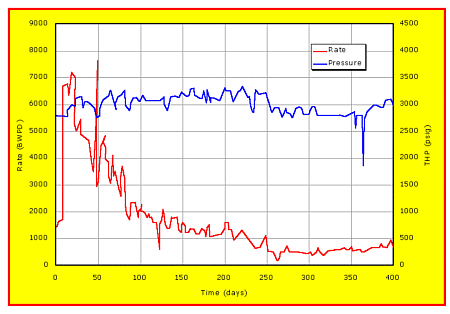
It can be surprising to realize the potential reduction in injectivity that can result from pumping dilute concentrations of small solids and oil. Wennberg, 1998, described injection into unfractured, gravel packed injectors in an unconsolidated sand in the Gulf of Mexico (Figure 1). Despite high native permeability, initial injectivity was low and repeated stimulation treatments were performed. After each stimulation, injectivity increased dramatically but then declined progressively more rapidly. The half-life of some of these wells was approximately 50 days. This means that within 50 days, the injectivity had decreased by 50% - economically unsatisfactory. It was concluded that fines were the culprits. The injected seawater was deoxygenated, filtered to at least five microns and treated for bacteria as well as inhibited for scale. The solids content in the seawater at the wellhead ranged from less than 1 to 7 ppm. None of the particles was larger than 4 microns and the average diameter was 2 to 3 microns. Available models for understanding injectivity, even for such radial flow scenarios, are inadequate. Modeling of hydraulic fractures resulting from injection is also difficult. van der Zwaag and Øyno, 1996, provided a field case that highlights the currently increasing percep-tion that almost all successful injectors are know-ingly or unknowingly hydraulically fractured. They described injection trials in the Ula field where the purpose of the injection was to supplement weak reservoir support. Seawater and seawater-produced water mixtures have been pumped. At the time of their publication they indicated rates of 200,000 BLPD into seven injectors. Additional information has been provided by Svendsen et al., 1991. Typical injection water, reservoir and completion properties are provided in Table 1.

Figure 1. Injection decline for Well A09 (matrix injection, unconsolidated, Gulf of Mexico). (From Wennberg, 1998).
Table 1. Typical Injection Water Properties
| Property | Seawater |
50%SW: 50%PW |
|
Total Suspended Solids, TSS (mg/l), including oil droplets |
0.6 - 13.0 | |
| Suspended Solids (mg/l) | 0.1-4.6 | 2.6-4.6 |
|
Mean Particle Diameter (microns) |
3.0 | N/A |
| Density (kg/m3) | 1023 | 1035 |
| Viscosity (cP) | 1.011 | 1.116 |
| Reservoir Height (feet) | 293 | |
| Hole radius (inches) | 4.25 | |
| re/rw | 1800 | |
| Perforations (spf) | 4 | |
| Perforation diameter (inches) | 0.5 | |
| Reservoir Permeability (md) | 173 | |
Various injection scenarios were evaluated and it was eventually discerned that the only reason that injectivity had been maintained was because the reservoir had been thermally fractured. After 45 days of injection "fractures with 2.2 m full height and 20 m to 34 m half length were measured." There is some controversy over these dimensions. This is addressed by van den Hoek et al, 2000.
|
<Models
|
Differences>
|
|
|
|
|
|
|