Plugging
It is known that the solids in produced water can be injected. The literature indicates field operations where several fracture volume equivalents of solids contained in the injected water have been successfully pumped. In these situations, the fracture volumes were inferred from ancillary testing procedures (hydraulic impedance testing, falloff surveys ...). This brings to mind the dominant question: "Where do the solids go?" van den Hoek et al., 1996, summarized the issue:
"An essential difference with simulation of conventional waterflood fracturing is that owing to fracture fill-up with injected solids the fracture conductivity cannot be assumed infinite any more. This relates to the important PWRI issue of where the injected solids go. Using our model, we show that the pressure drop over a finite conductivity fracture can lead to a significant increase in fracture volume without necessarily leading to a significantly higher pressure. Thus, a picture emerges in which the fracture conductivity 'adjusts' itself in order to accommodate injected solids. This picture allows the computation of well injectivity as a function of total injected water volume, solids loading, etc. This concept can also be used to qualitatively explain the PWRI field observation that injectivity appears to be partially or fully reversible as a function of water quality."
Wennberg, 1998, and Wennberg et al., 1995, presented the most comprehensive evaluation of water injection damage mechanics to date. The formation adjacent to the hydraulic fracture will be damaged due to particulate injection. Various empirical measurements have been made to facilitate representing injectivity decline as a function of injected volumes; particularly for matrix injection. Some of the highlights of these efforts are summarized below.
Donaldson et al, 1977, showed that particles initially pass through the larger openings in a core and are gradually stopped by a combination of sedimentation, direct interception and surface deposition. They found that the larger particles initiate cake formation. Davidson, 1979, found that the velocity required to prevent particle deposition is inversely related to the particle size (for the systems evaluated at least). Core measurements by Todd et al., 1984, showed that the overall damage is related to the mean pore throat size. Cores damaged with aluminum oxide particles (with diameters up to 3 microns) exhibited damage along their entire length and as the particle size increased the damage gradually shifted to the injection end and external cake. Vetter et al, 1987, found that particles with sizes from 0.05 to 7 microns caused damage and that the larger particles caused a rapid permeability decline with a short damaged zone. Permeability reduction with smaller particles was more gradual.
In conjunction with experiments, various researchers have attempted to mathematically characterize the mechanics of how fluid loss of water with particulates will damage the surrounding media. Most of these efforts have been continuum models based on conservation principles. The basic mass conservation relationship for one-dimensional flow is:
![]() (1)
(1)
f is porosity,
c(x) is the volume fraction of solids in the liquid,
x is the position,
s(x) is the volume fraction of trapped particles with respect to the bulk volume,
~ indicates averaging,
A is the cross-sectional area,
u is velocity,
t is time, and,
D is the dispersion coefficient.
Assuming incompressible flow, neglecting diffusion, assuming that particle deposition is the only mechanism for changes in porosity and finally assuming that c << 1:
![]() (2)
(2)
Iwasaki, 1937, worked on deep-bed filtration in sands and indicated that:
![]() (3)
(3)
where:
l is a filtration coefficient (1/cm).
Many of these concepts have been applied to comprehending how fluid loss is a transient process in matrix produced water reinjection. For example, Barkman and Davidson, 1972, outlined four mechanisms where entrained fines in the injection stream could reduce injectivity (Figure 3). These included development of an internal filter cake, where the particles invade the formation and are ultimately retained, reducing permeability; the consequent development of an external filter cake (the wall-building analog); plugging of perforations or other completions hardware; and, progressive coverage of the injection interval due to wellbore fillup. They derived expressions for the time, ta where the injectivity decline ratio, a = I/I0 (I is the injectivity index), has been reduced from 1 to a. a = 1/2 refers to the half-life of the well (cylindrical reservoir). Barkman and Davidson outlined a method to determine the water quality ratio where the suspension was flowed through a filtration membrane at a constant pressure to build an external filter cake, giving a straight line on a plot of cumulative injected volume versus the square root of time. Eylander, 1988, revised the Barkman and Davidson model on the basis of core flooding measurements. His relationships accounted for porosity of the filter cake. van Velzen and Leerlooijer, 1992, hypothesized on the variation of particle concentration with position:
![]() (4)
(4)
where:
cin is the inlet concentration.
All of these models account for external and internal cakes separately. Pang and Sharma, 1994, extended these relationships by considering mutually interactive formation of internal and external filter cakes with flow. They introduced the transition time, t*, which they related as the time when the deposition mechanisms change from internal filtration to external filter cake buildup. It was postulated that internal cake forms first, that as more particles are trapped on the surface a point is reached where invasion is limited, and that this is the time, t*, when the initial layer of external cake is formed. Before the transition time, internal filtration is applied and after external filtration is used. Other relevant references on matrix damage (i.e., the mechanics of formation plugging when there is no hydraulic fracture or there is a hydraulic fracture that is not propagating) include Khatib and Vitthal, 1991, and Khatib, 1994.
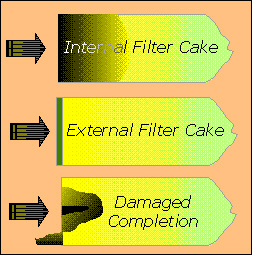
Figure 3. Schematic of mechanisms for particulate damage.
This is only part of the problem. Presuming that there is a mathematical methodology for inferring the variation of particle concentration with time and depth into the formation, it is also necessary to infer the variation of permeability due to the particle concentration (and ideally, using this new permeability distribution to infer future variations in the concentration profile). Models for explicitly calculating permeability change are based on Darcy's law and are usually single phase. Some empirical (semi-logarithmic - Nelson, 1994, or power law - Rumpf and Gupta, 1971) relationships are used to interrelate porosity and permeability; porosity being determined from the deposition modeling. Many models still fall back on Kozeny-Carman representations, which have never been particularly successful.
A new perspective on fines deposition in porous media has been demonstrated numerically (using a mesoscopic model) by Wennberg et al., 1996. They alleged that two generic classes for deposition are permeability reduction in bands orthogonal to the mean flow direction (localizations) or in bands parallel to the mean flow direction (wormholes). Which type of damage forms depends on the local pore velocity. "The possibility of low-permeability bands and high-permeability wormholes further complicates modeling."
This area is incredibly complicated. Wennberg proposed engineering simplifications and outlined possible scenarios for the evaluation of the filtration coefficient. Wennberg recognized that it was important to consider linear flow situations as well as radial, recognizing the overwhelming number of injectors that are actually hydraulically fractured. Conceptually at least, at the fracture tip, (infinite conductivity) the velocity will be higher and particles will be transported to the tip causing fracture tip plugging. Eventually, leakoff will stabilize along the length of the fracture. If the whole fracture has a finite conductivity due to accumulation of particles, the flow pattern can deviate considerably from the purely elliptical flow pattern around infinite conductivity fractures (refer, for example, to Liao and Lee, 1994).
Unfortunately, it is difficult to strictly apply these matrix injection mechanisms to situations where it is known that hydraulic fracturing is occurring. "Field experience shows that wells have been able to inject produced water over several years, despite injecting volumes of contaminant that significantly exceed any calculated fracture volume. Thus, not all the material injected into the fracture remains there, although in some cases the extrusion of sludge on shutting in of wells indicates that at least some of the material remains in the fracture. Material that remains within the fracture may be deposited as a low permeability filter-cake, as a fracture tip plug, it may form bridges with the fracture. Material may also be transported into the formation causing an impairment by relative permeability effects."
It is important to realize that injectivity of produced water under fracturing conditions is determined by entirely different mechanisms than injection of produced water under matrix conditions. Plugging of the rock matrix by internal and external filter cake during produced water reinjection while fracturing do not by themselves cause significant injectivity decline.
| <Thermo-Poro-Elasticity | Fluid Loss> |
|
|
|
|
|
|